
Create a custom report dashboard in analytics [open beta]
⚠️ This feature is in open beta. This article may require final changes before the feature is moved to general availability.
Overview
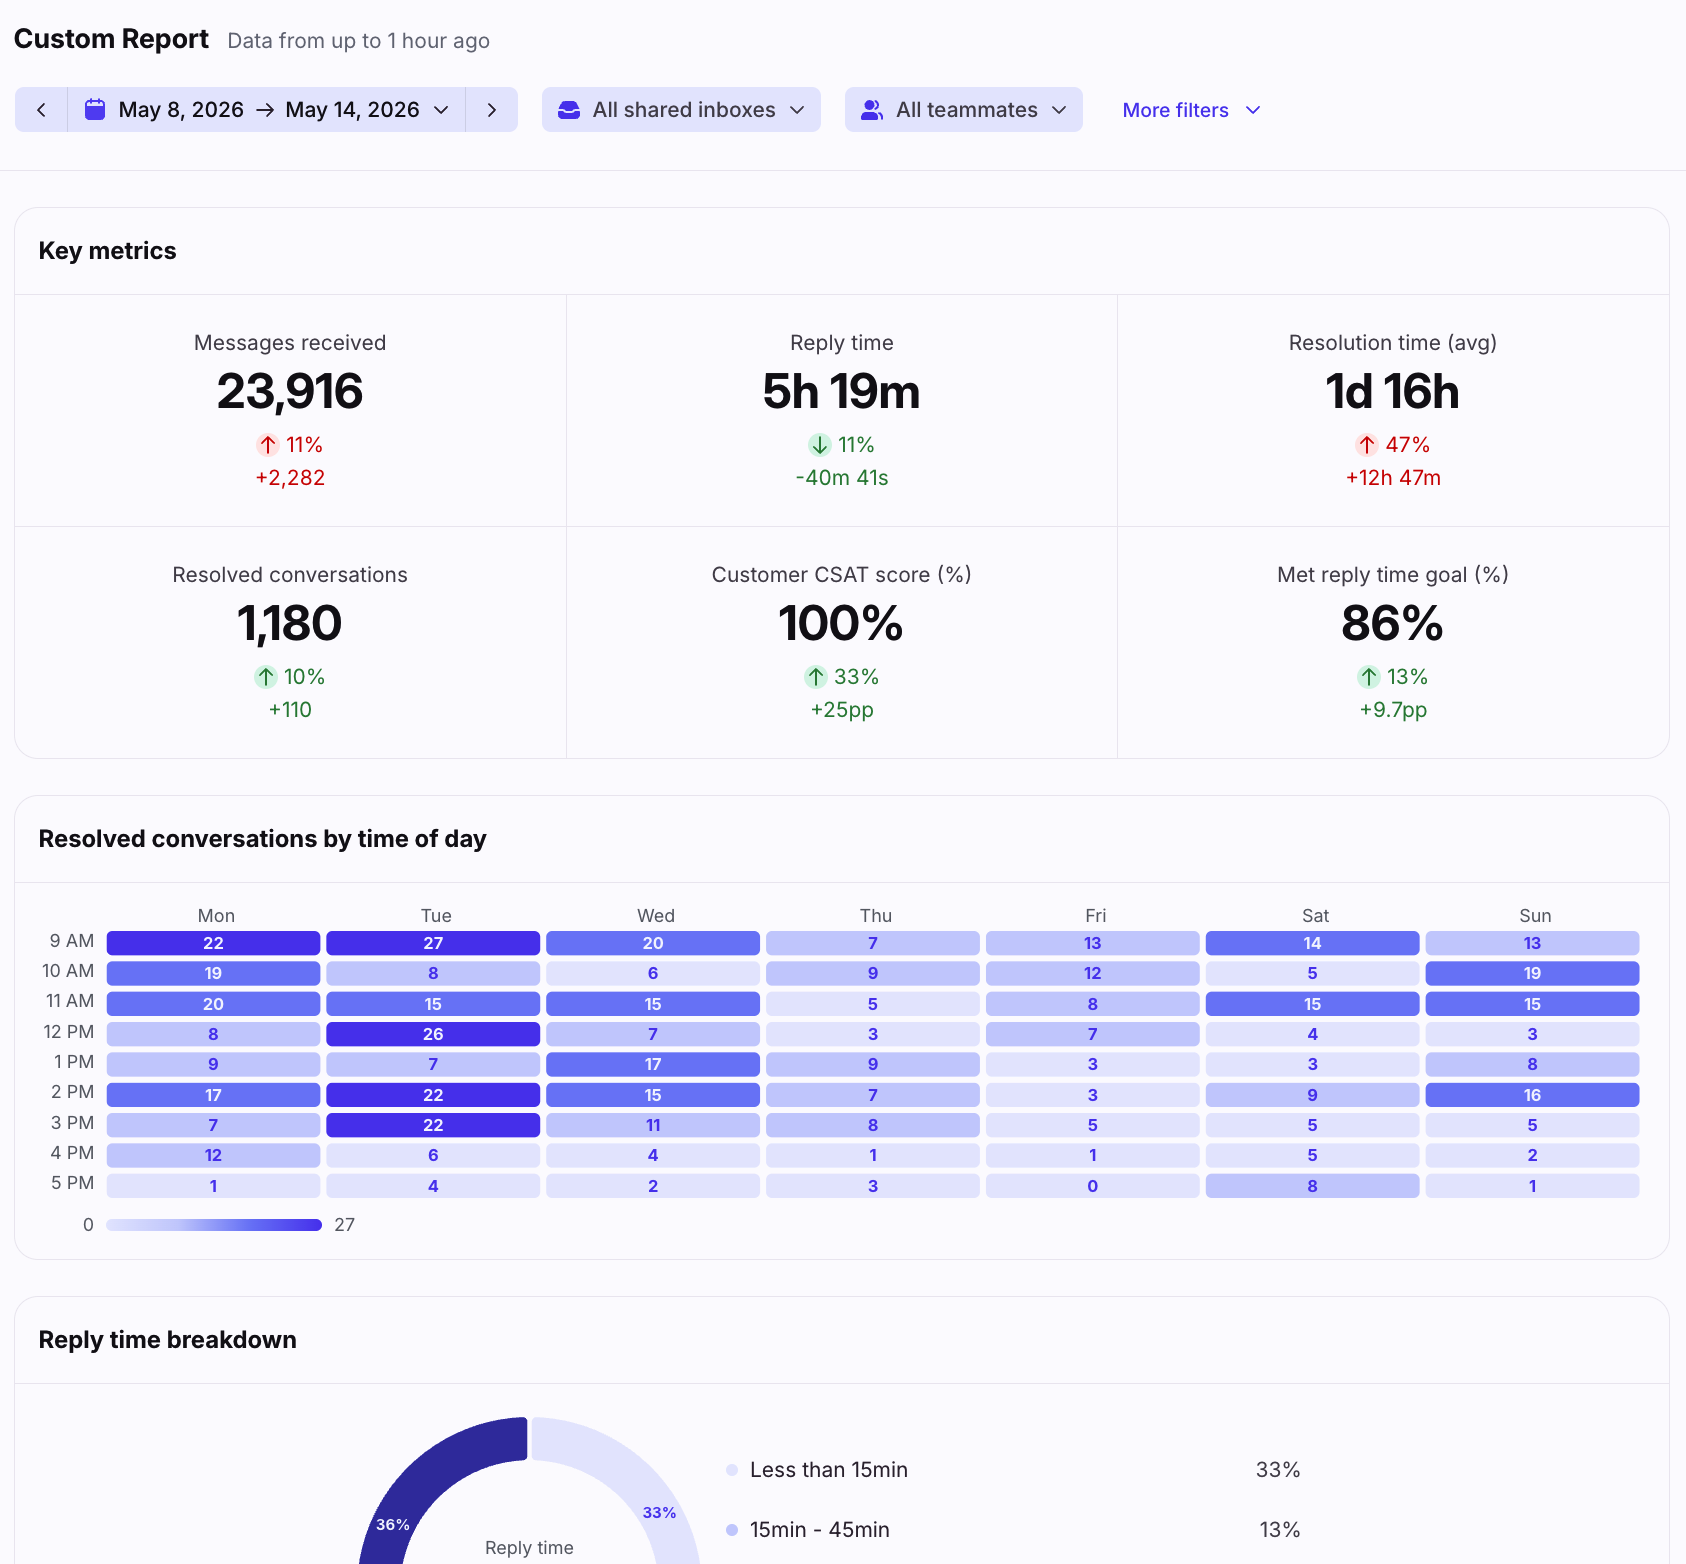
In Front Analytics, you can create a custom report dashboard to pull together your favorite charts from existing analytics reports. Use this personal dashboard to quickly view all your preferred charts and metrics in one place.
Creating a custom report
Step 1
In the navigation menu, select Analytics.
Step 2
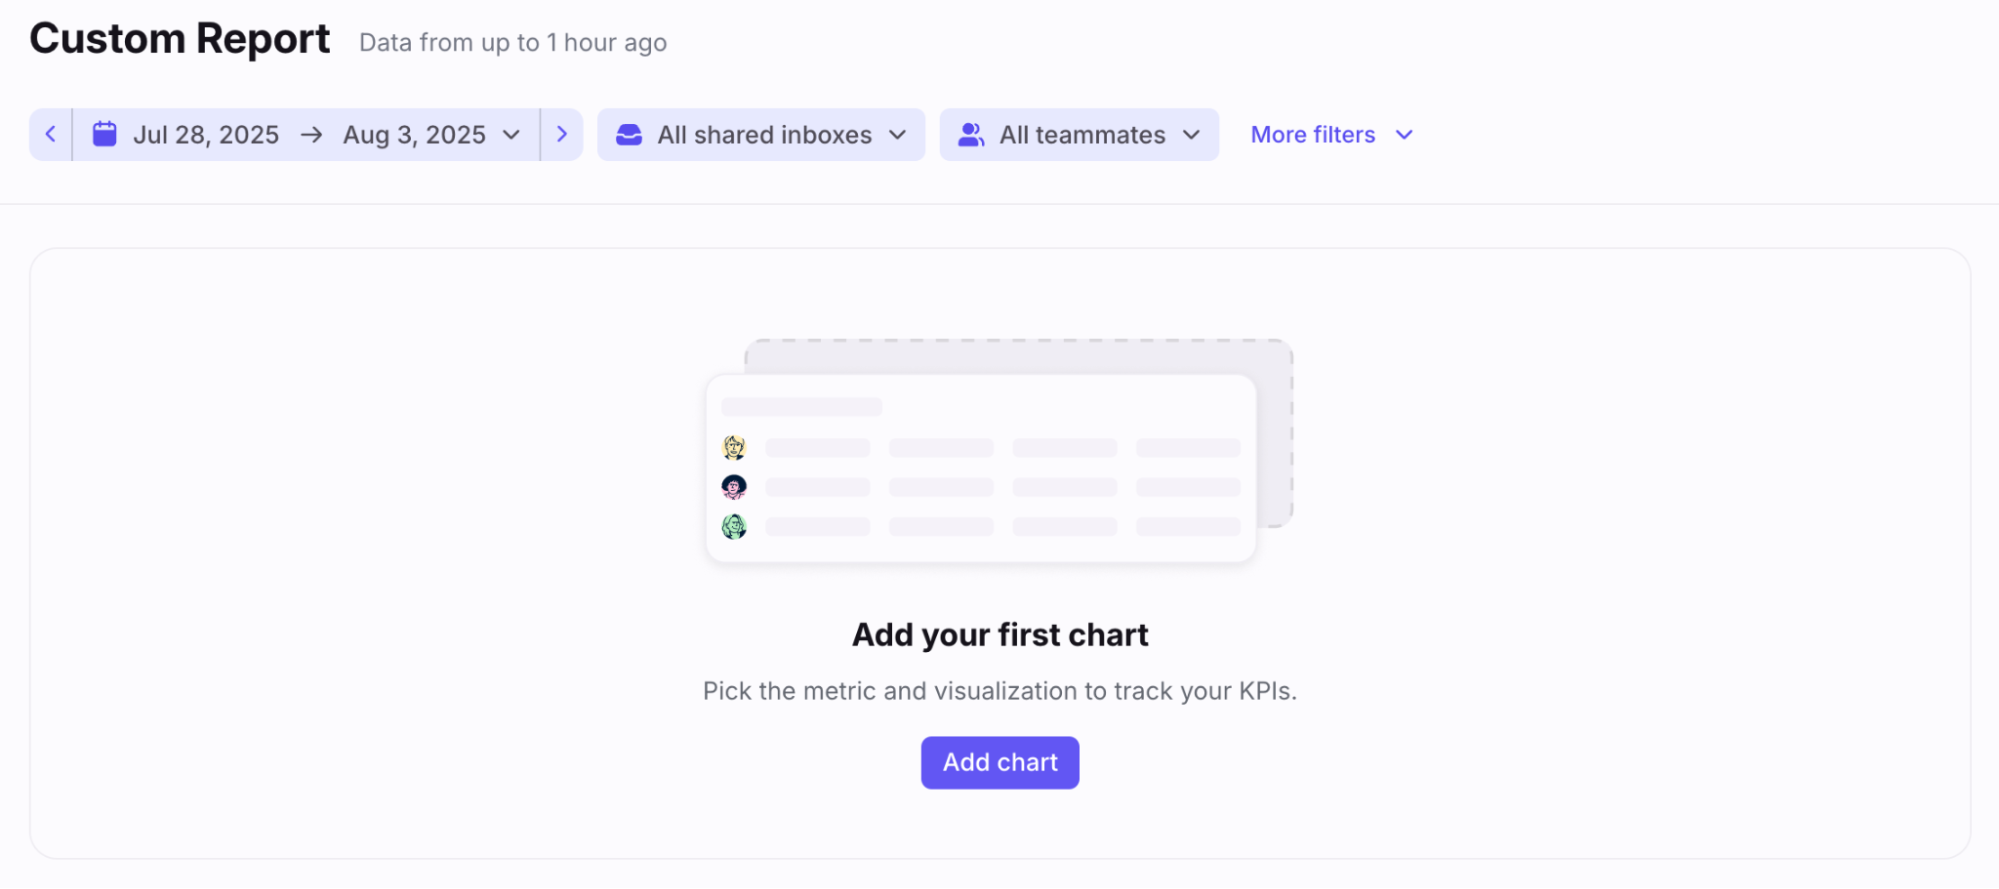
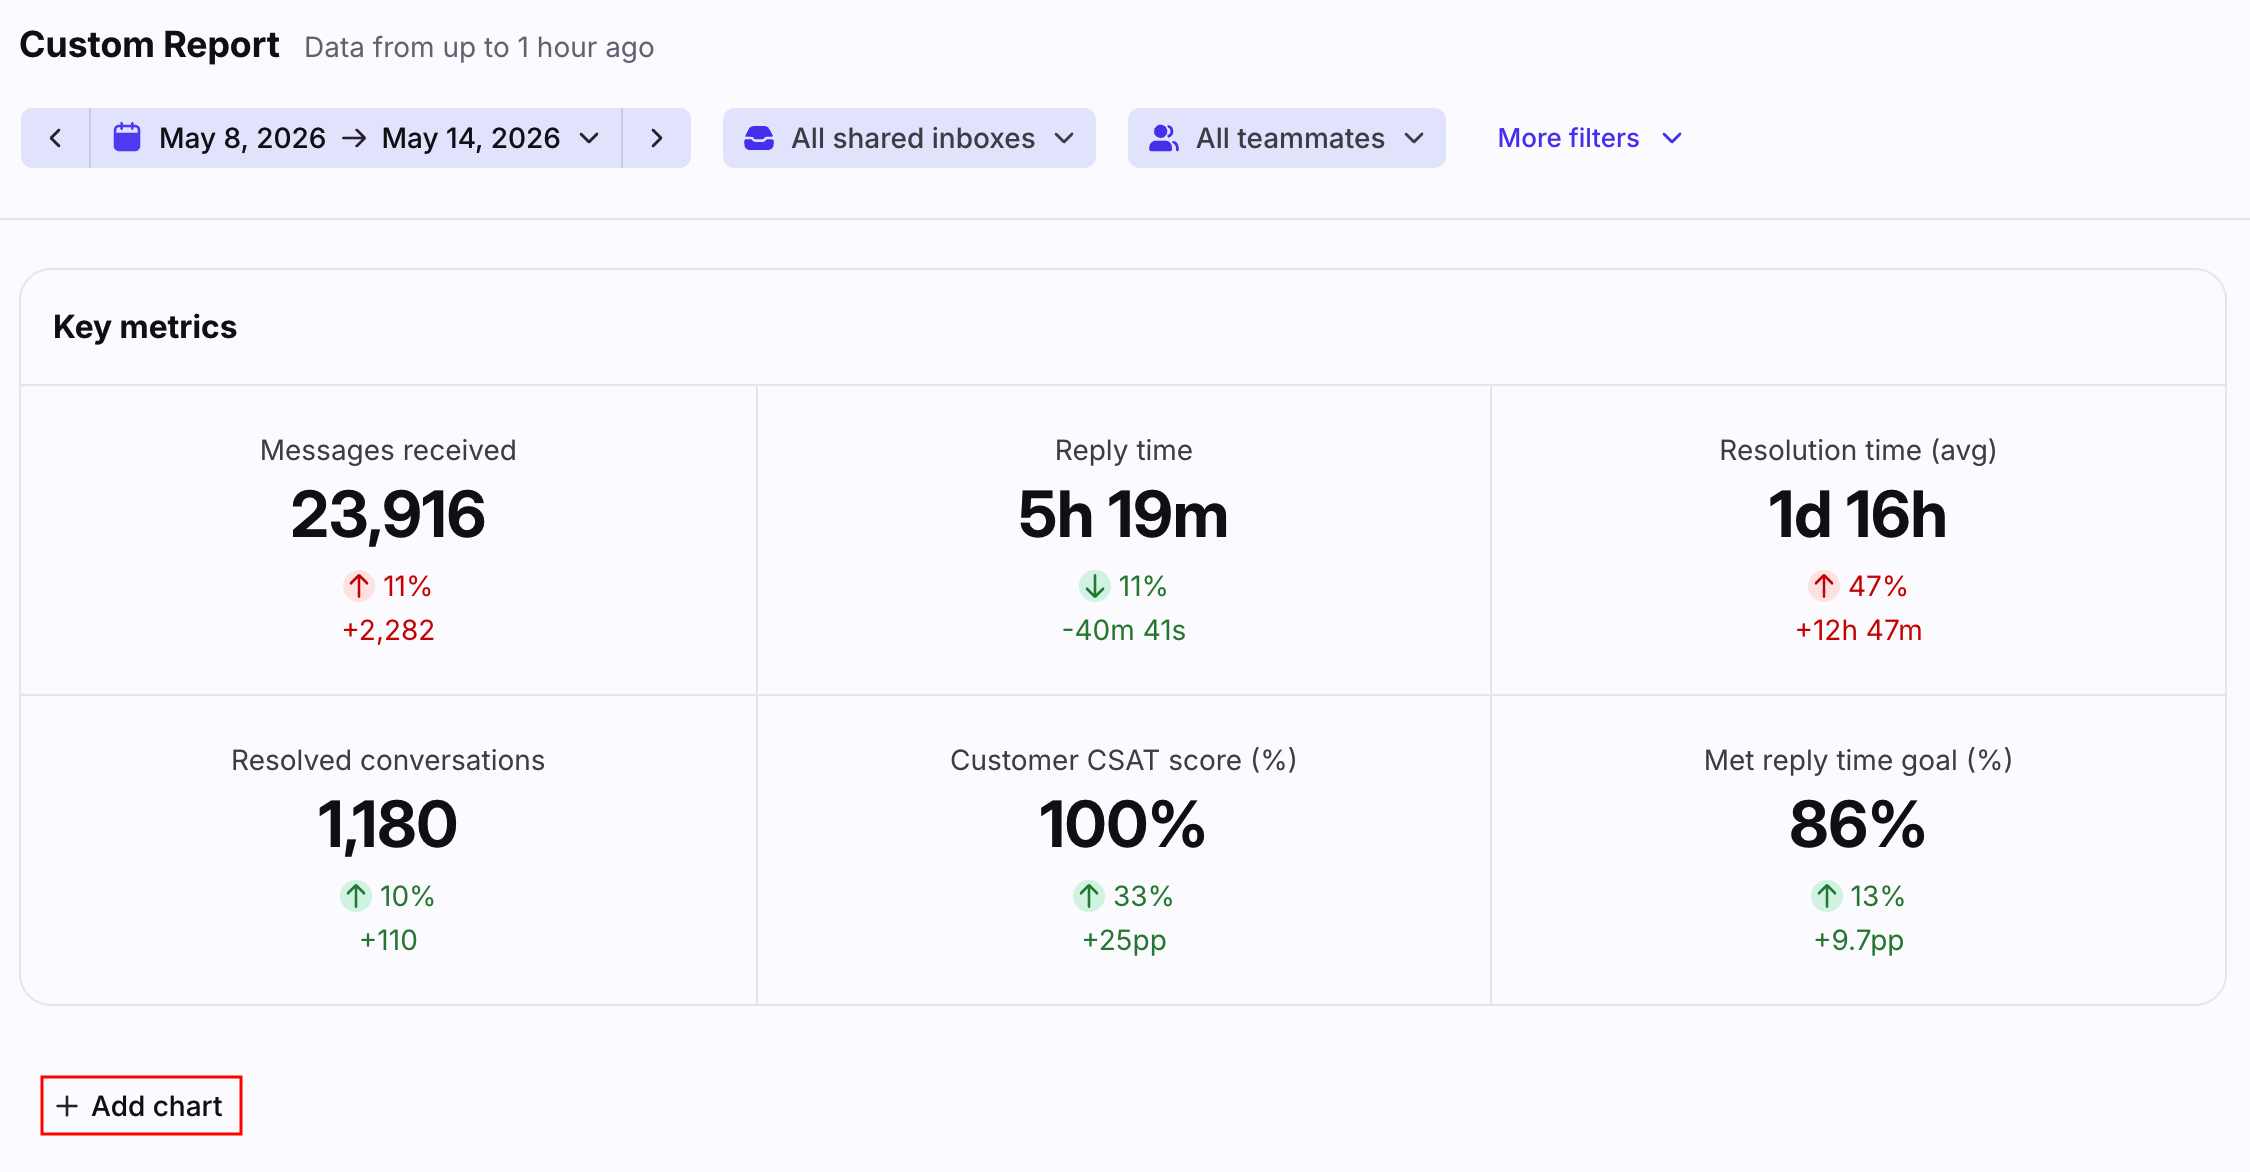
In the left sidebar, choose workspace, company, or personal analytics, then select Custom report. Click Add chart.
Step 3
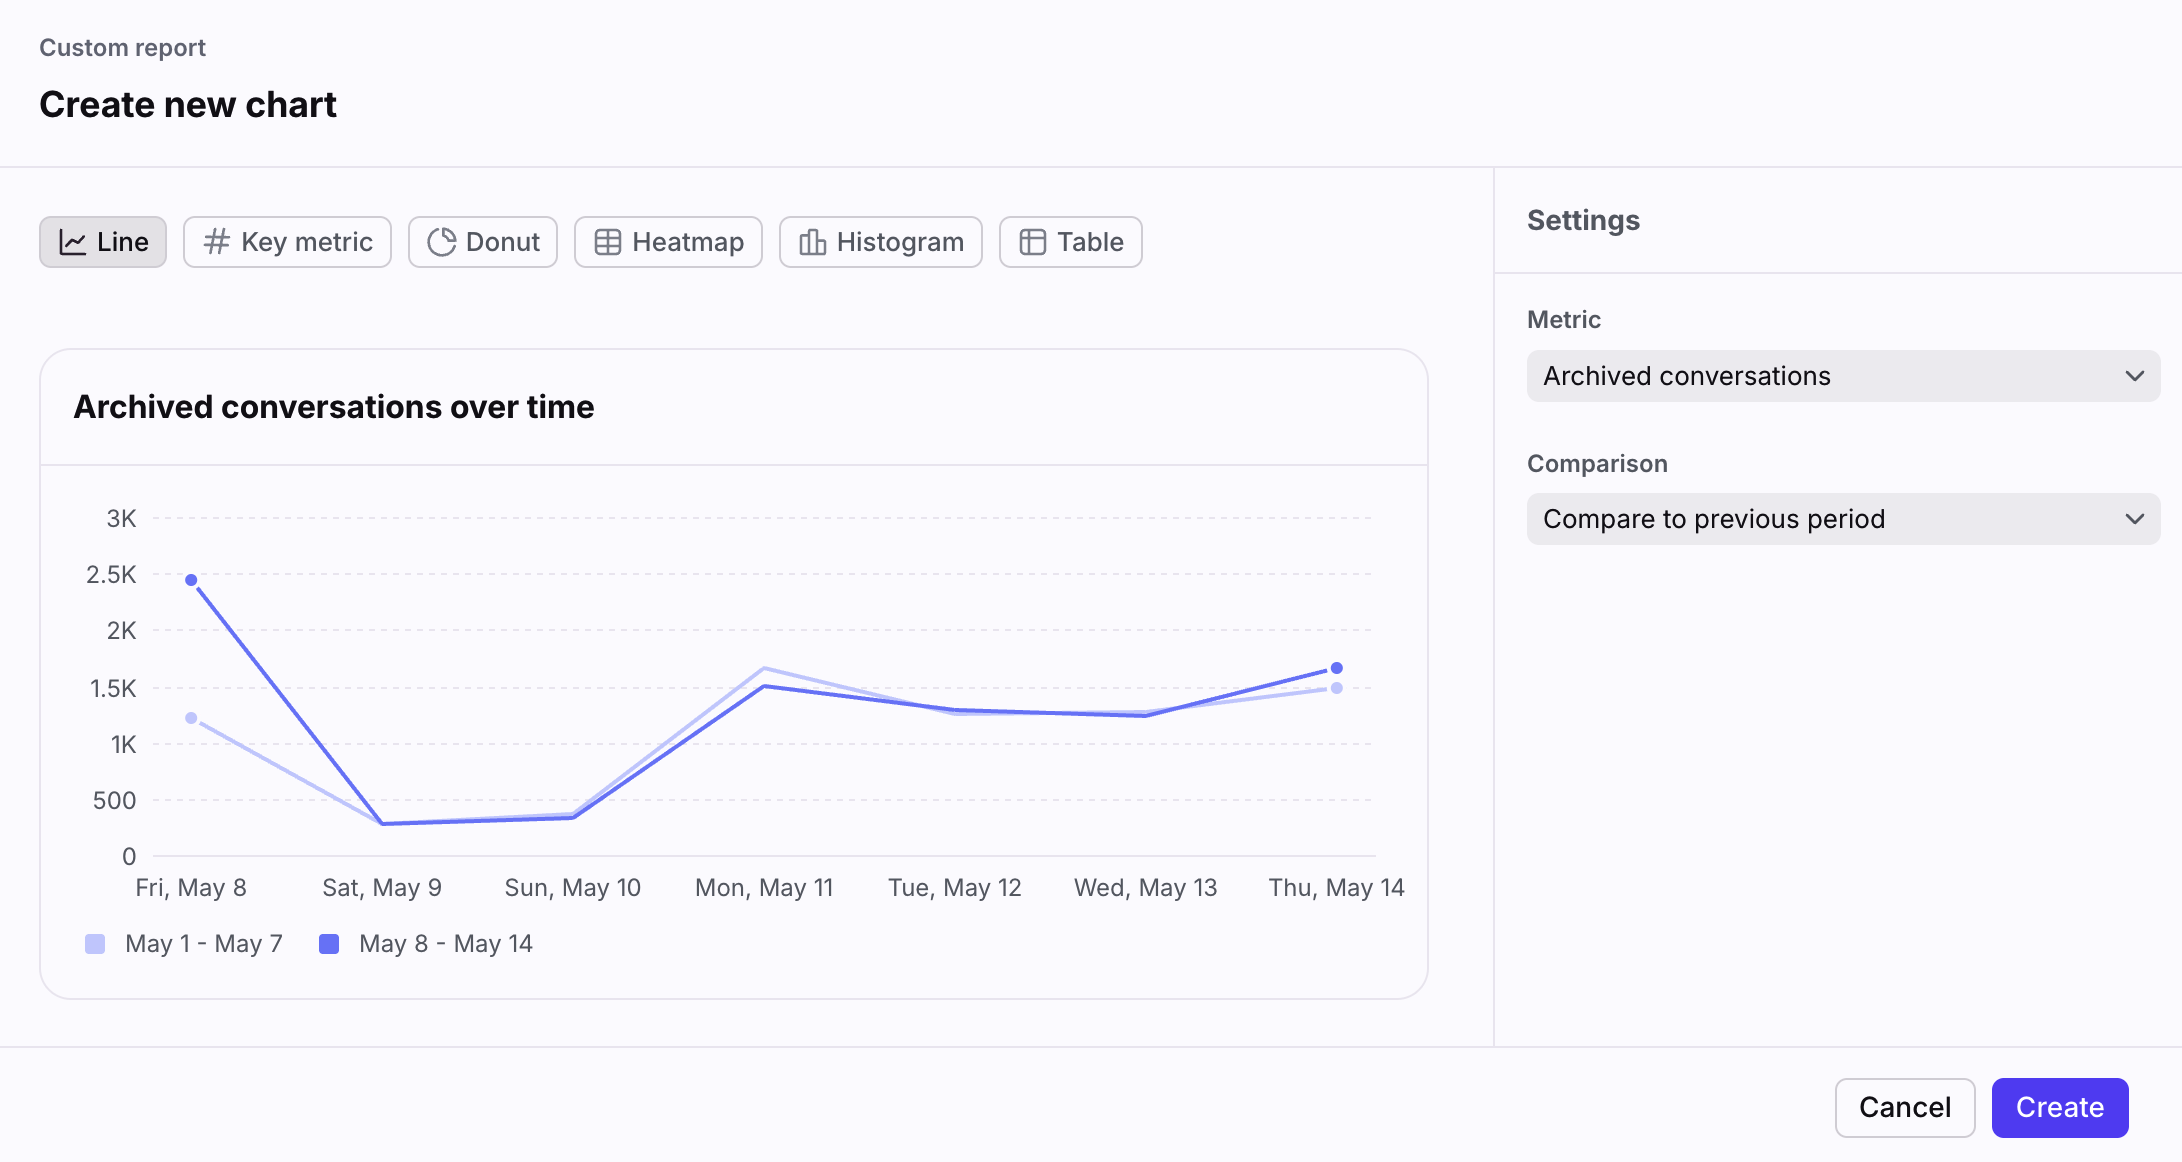
Select the chart type you’d like to add to your custom report, then select the metrics you’d like to focus on. Click Create.
Step 4
Click Add chart to continue adding charts to your custom report.
Step 5
Use the arrow icons to reorder your charts, or click Edit to adjust the metrics displayed in the chart, duplicate the chart, or delete the chart.
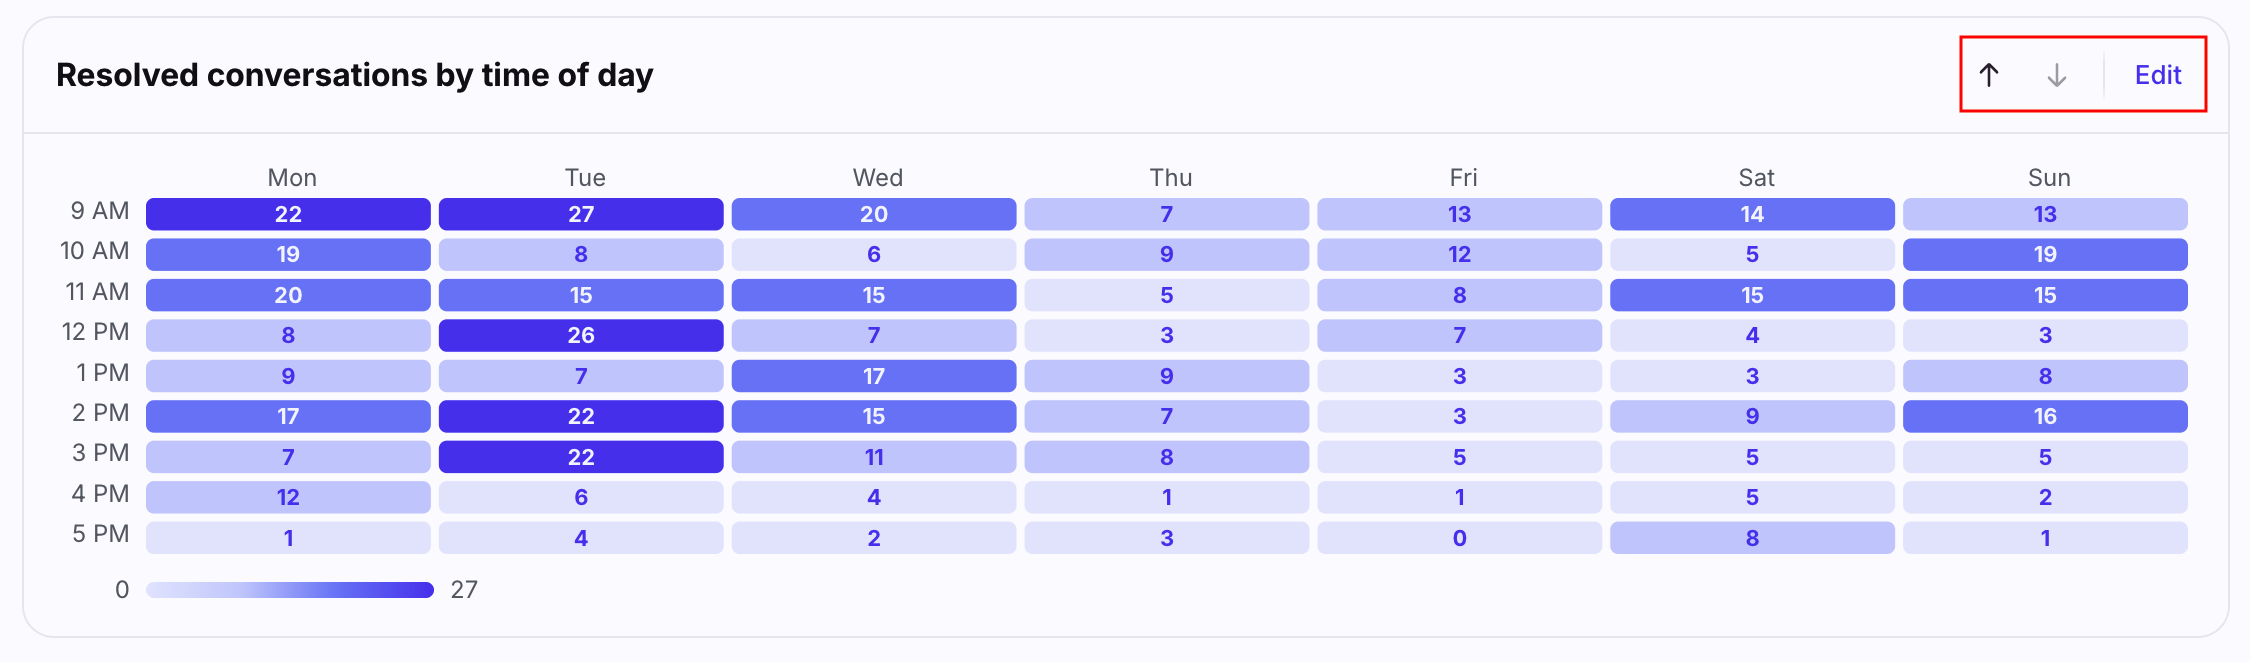
Chart types
Line
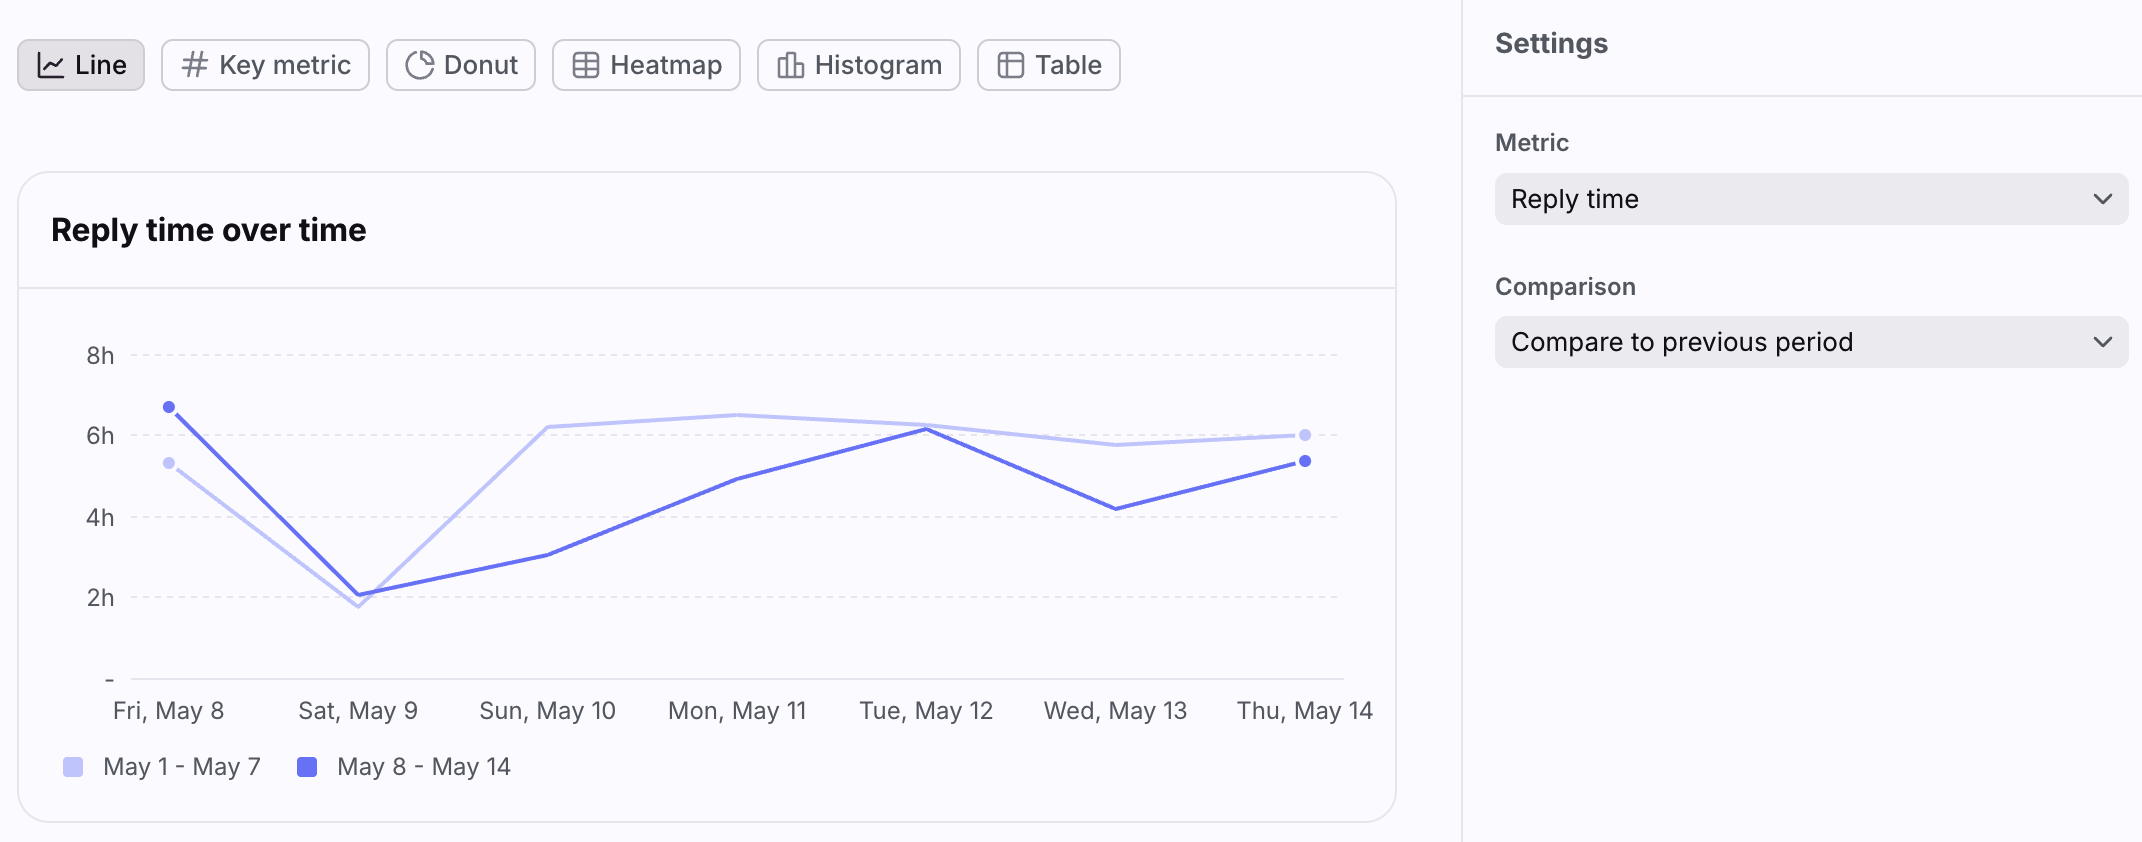
Features
The line chart allows you to identify changes over time for a single metric.
Select Compare to previous period to display values from the previous period based on the timeframe you’ve selected.
List of metrics
Customer CSAT score
Smart CSAT score
Customer CSAT rating
Smart CSAT rating
Key metrics
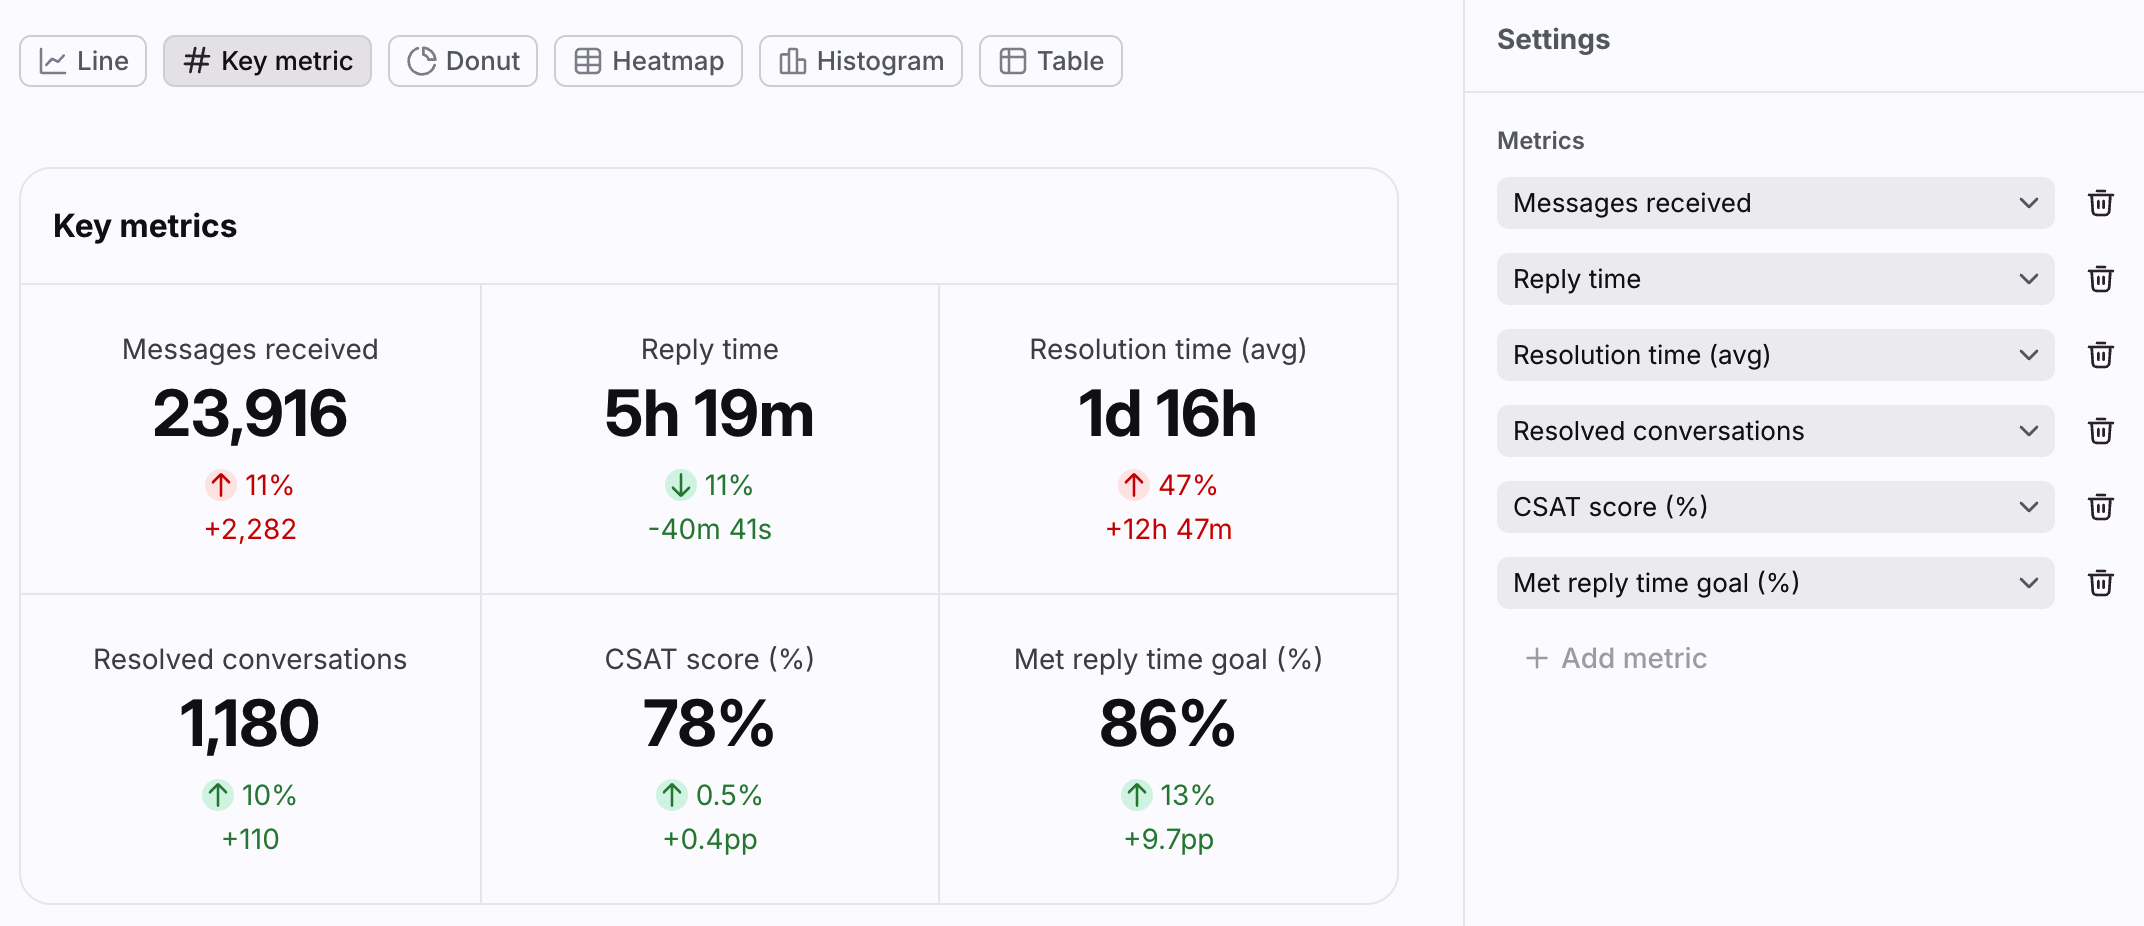
Features
Select up to 6 metrics to focus on in the key metrics chart. These metrics allow you to understand team performance at a glance.
The metrics in the chart automatically sort. It is not possible to manually reorder the metrics at this time.
List of metrics
Customer CSAT score
Smart CSAT score
Customer CSAT rating
Smart CSAT rating
Donut
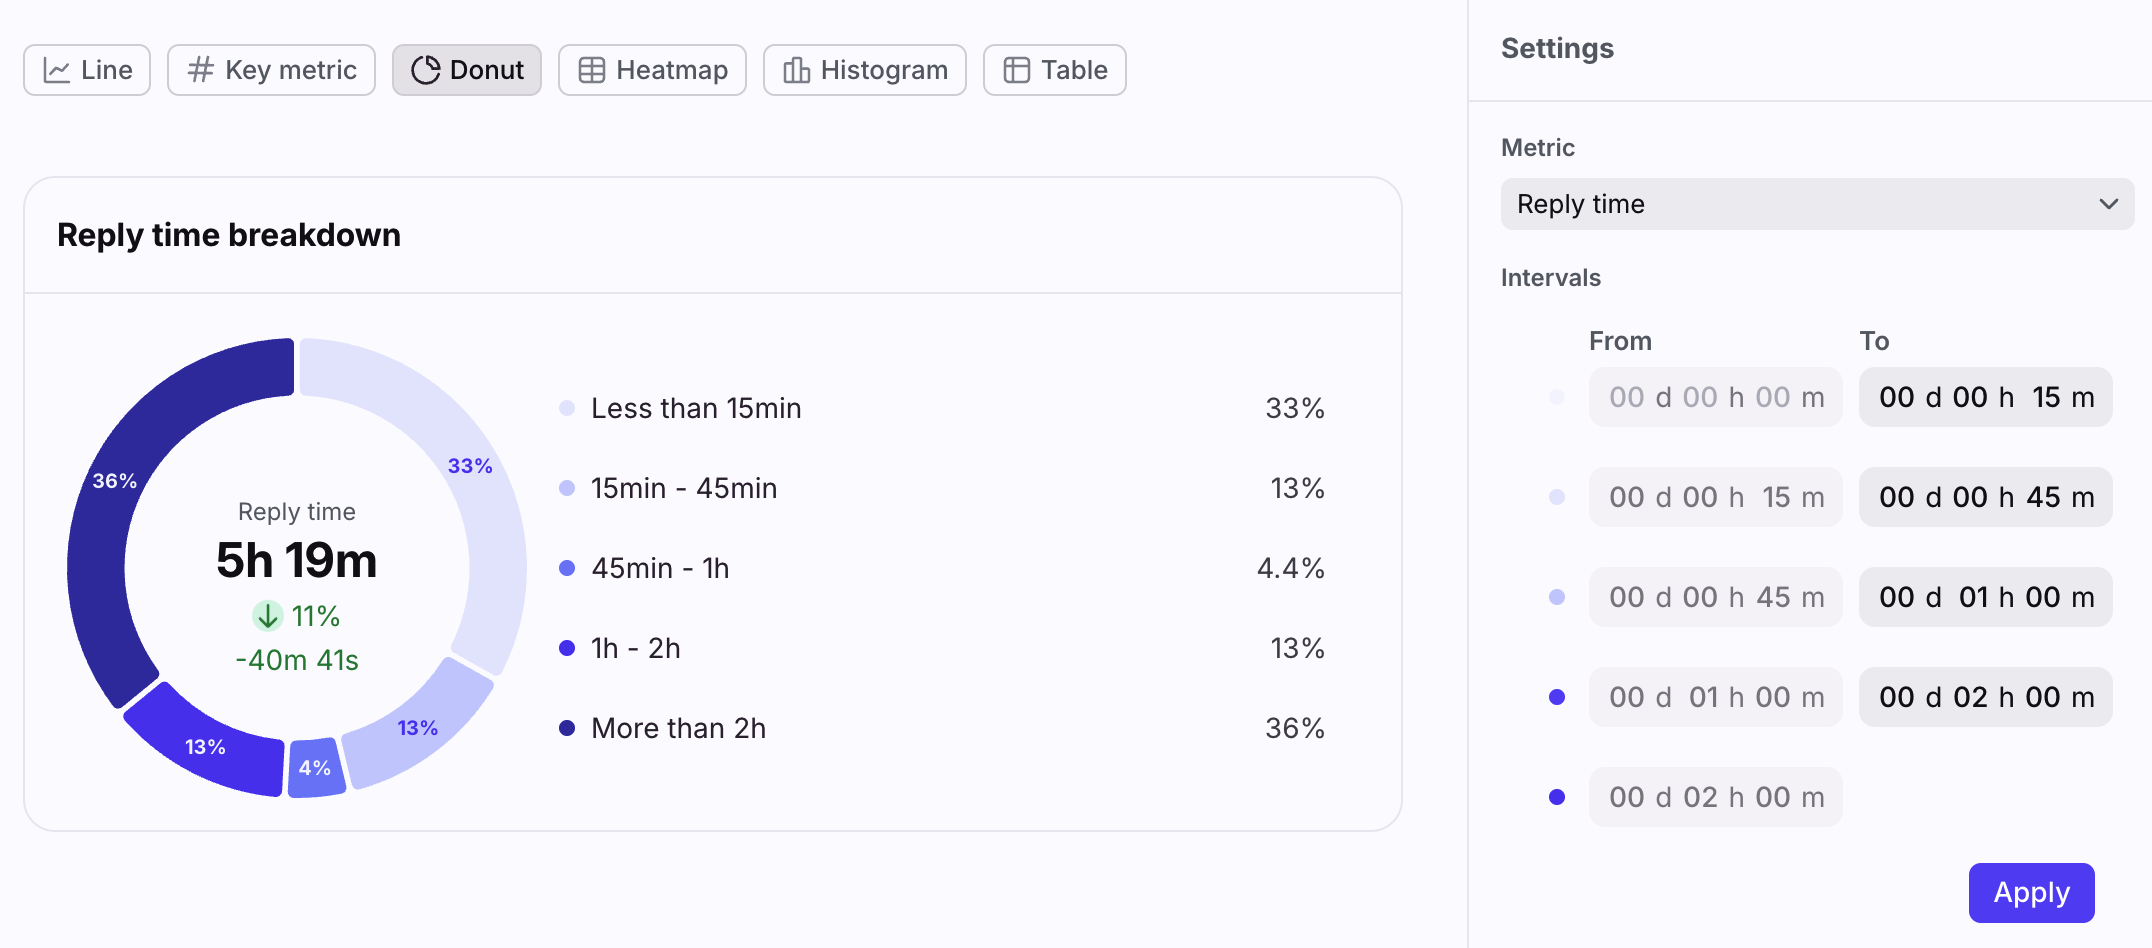
Features
The donut chart allows you to visualize how categories compare to each other for a single metric.
For some metrics, you'll see fields to configure the intervals you want to see in the donut chart.
For the CSAT score metric, you’ll see a field to enter your CSAT score goal.
List of metrics
Customer CSAT score
Smart CSAT score
Heatmap
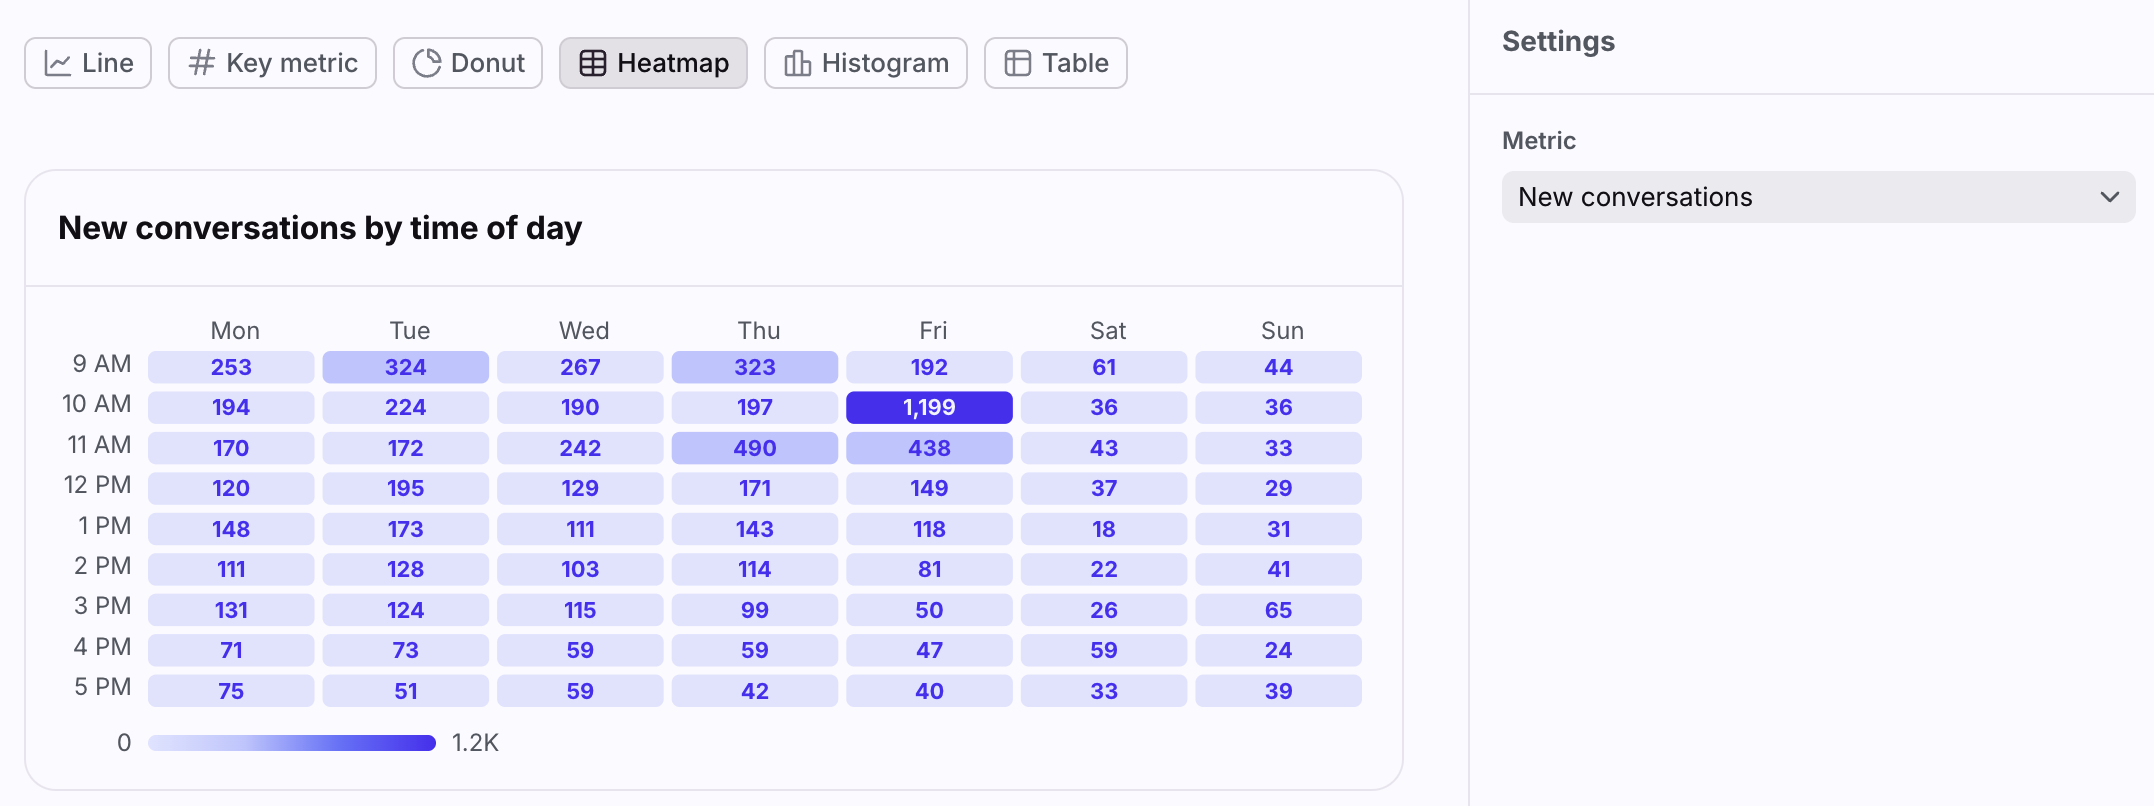
Features
The heatmap chart shows when your busiest times are for a single metric.
List of metrics
Histogram
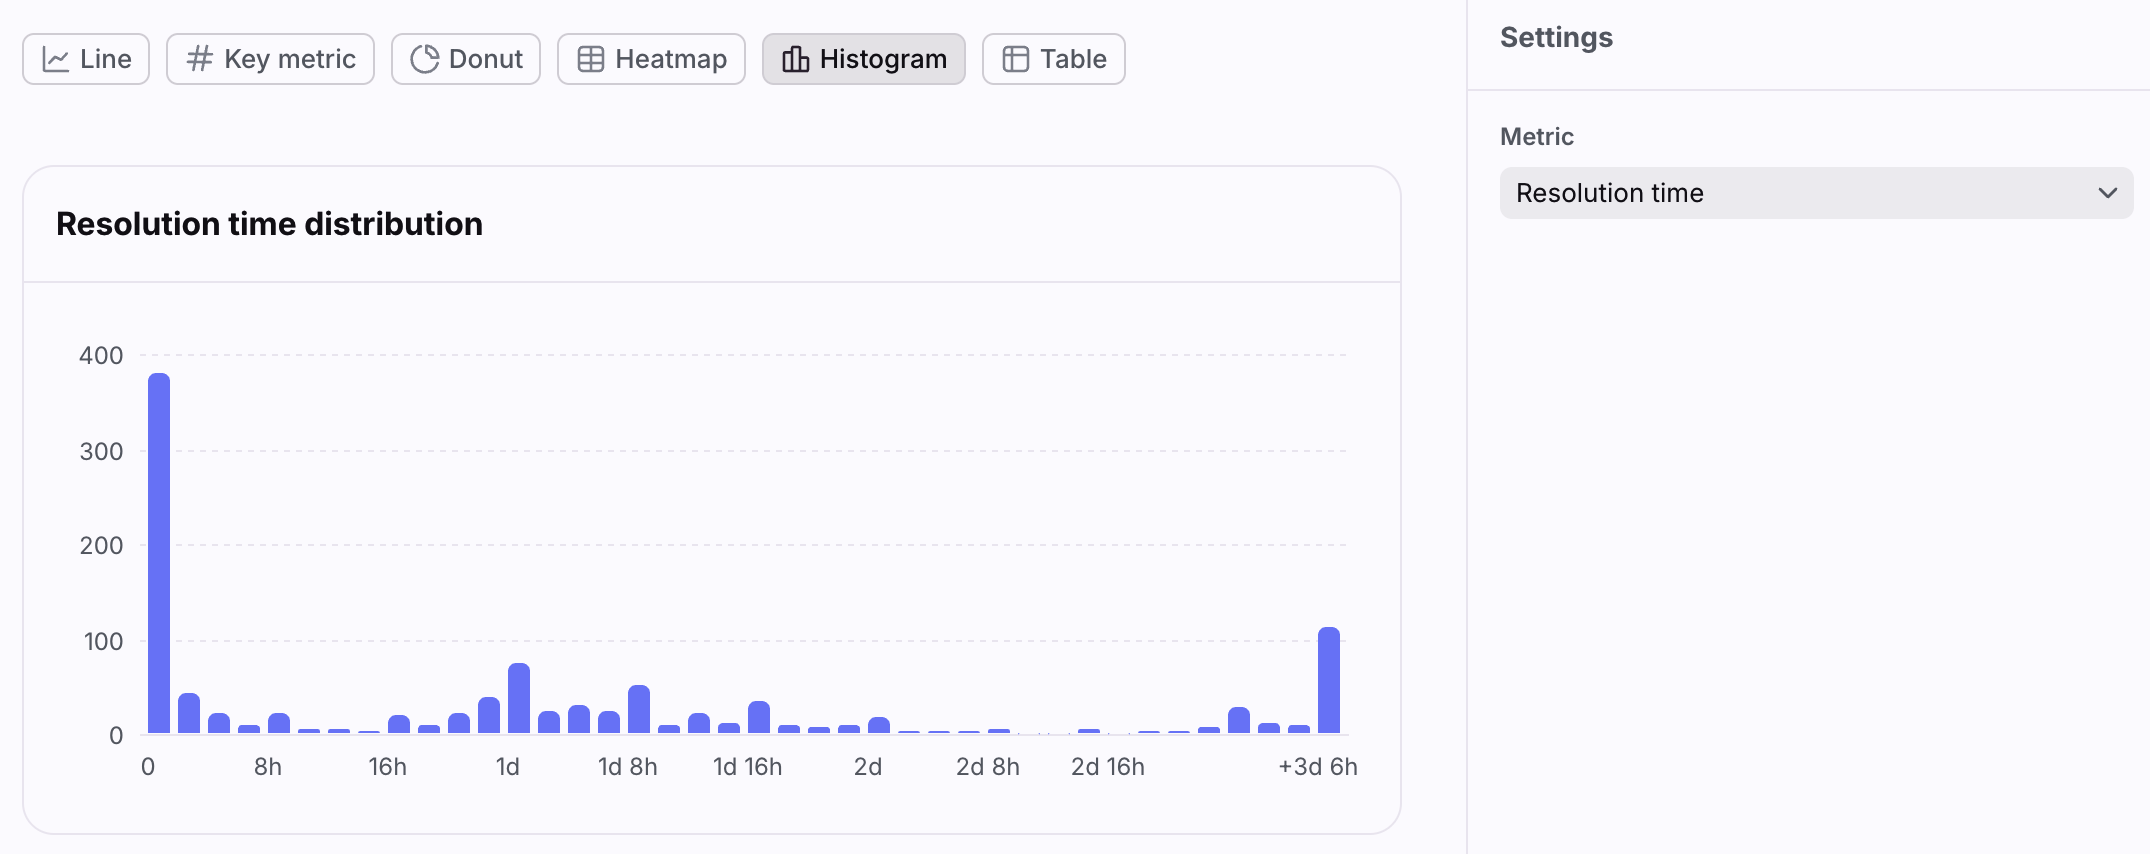
Features
The histogram chart allows you to break down data for a single metric into buckets, helping you better understand your team’s performance and identify outlier conversations.
List of metrics
Table
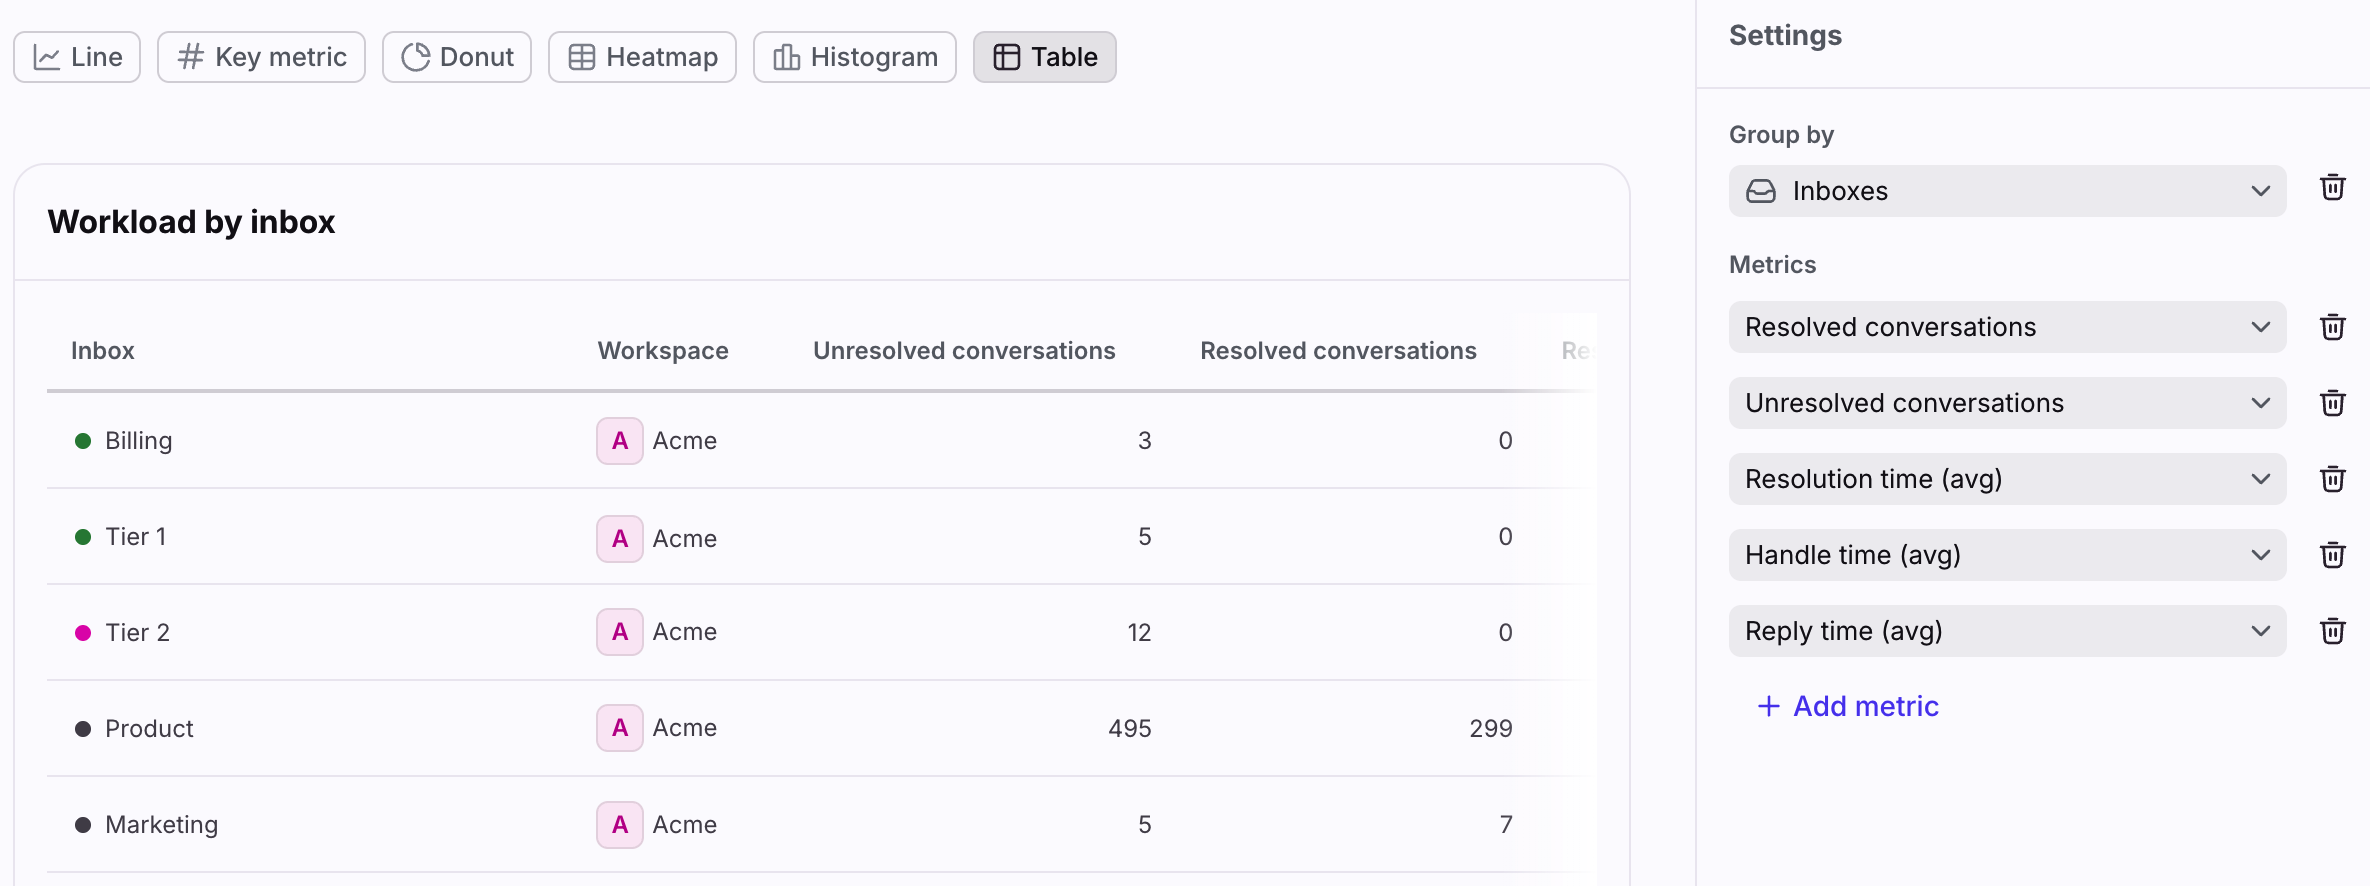
Features
The table chart allows you to group your analytics data via the resources listed below. This allows you to view exact details and easily compare your metrics.
List of metrics
Inboxes
Teammates
Topics
Tags
Message templates
Smart QA reviews
QA reviews
QA score (%)
[Criteria name selected in scorecard] (%)
CSAT reviews
Teammate
Contact
Account
Date
Reply time goal rules
Time goal
Conversation custom fields
Note: Only “Dropdown” and “Yes or no” type fields are supported at this time. Data is not available for conversation segments closed before early Feb 2026.
FAQ
How many custom report dashboards can I create?
Each teammate can create one dashboard per workspace.
How many charts can I add to one custom report?
You can add up to 10 of each chart type to one custom report.
Do the report filters carry over to other reports?
No. The custom report filter selections are separate from the other analytics reports. If you navigate back and forth between your custom report and other reports, your custom report will retain its own set of filters except for the date range.
Do analytics views work with custom reports?
No. The custom report filters and layout automatically save based on your changes.
Can I share my report or schedule report emails?
Not at this time. However, this is on the roadmap for a future update.
Pricing
This feature is available on the latest Enterprise plan only.