
Team performance report
Overview
The Team performance report is the ideal place to monitor your team productivity, identify when your team is overloaded, and help you make the right decisions to best serve your customers. You can understand how each of your teams perform and the volume of conversations each person participates in.
Take a Front Academy course here to learn more about leveraging Front analytics to achieve your goals.
Report sections
Key metrics chart
Features
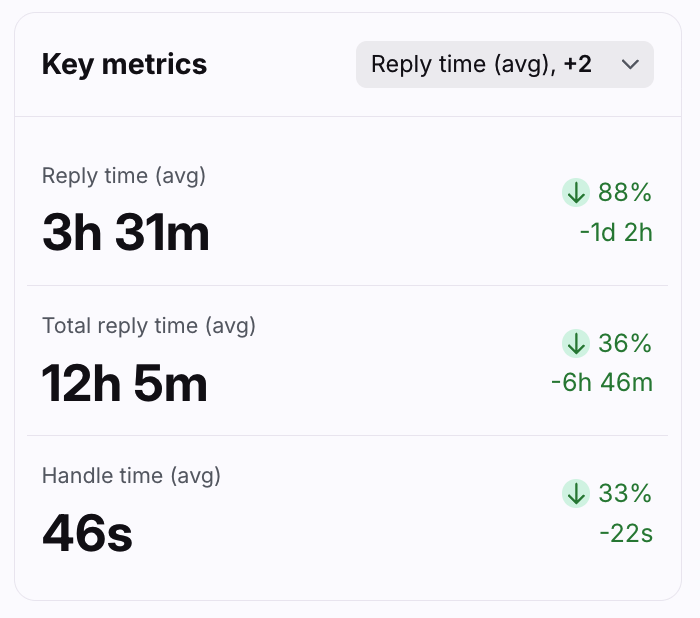
Three Key metrics cards are featured here to call out the metrics that had the biggest changes from the previous time period.
Click the dropdown at the top of this section to select which metrics you want to display, listed below.
Each card displays the name of the metric, the current measurement, and the change compared to the previous period.
Click on each metric to see the metric details and list of conversations counted in the metric.
List of metrics
Busiest times heatmap
Features
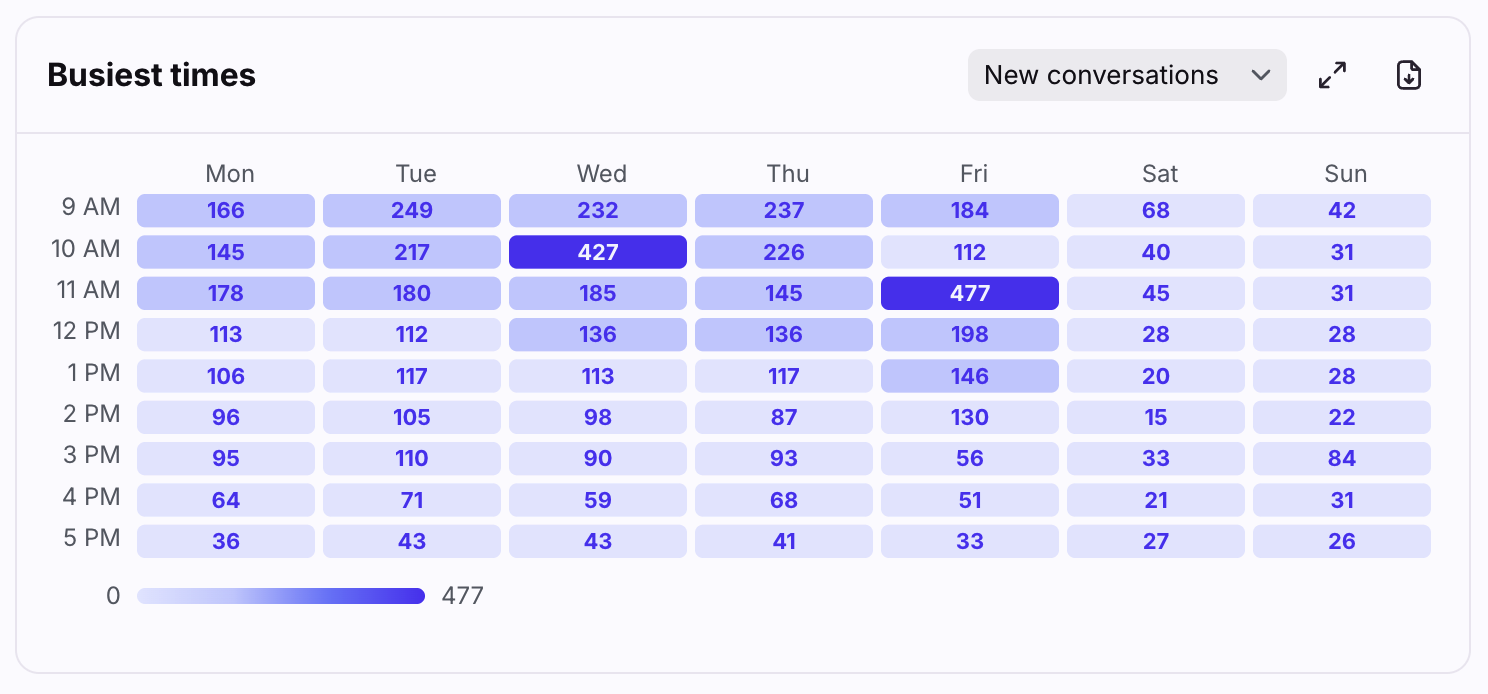
The Busiest times heatmap shows when your busiest times are, populated from the metric data you choose. Use this heatmap to help determine when you may need more staffing.
Click the dropdown menu to choose which metric you want to view as a heatmap. The full list of metrics is below.
A color legend on the bottom left shows the range for the metric, with darkest being the most busy.
The heatmap shows your business hours by default. To see all 24 hours, click the expand icon in the top right.
Click on each metric to see the metric details and list of conversations counted in the metric.
List of metrics
*Ticket statuses must be enabled to view these metrics. If your workspace has an active conversation stages rule, your metrics will be based on conversation stages instead. See this article to learn more.
Team performance table
Features
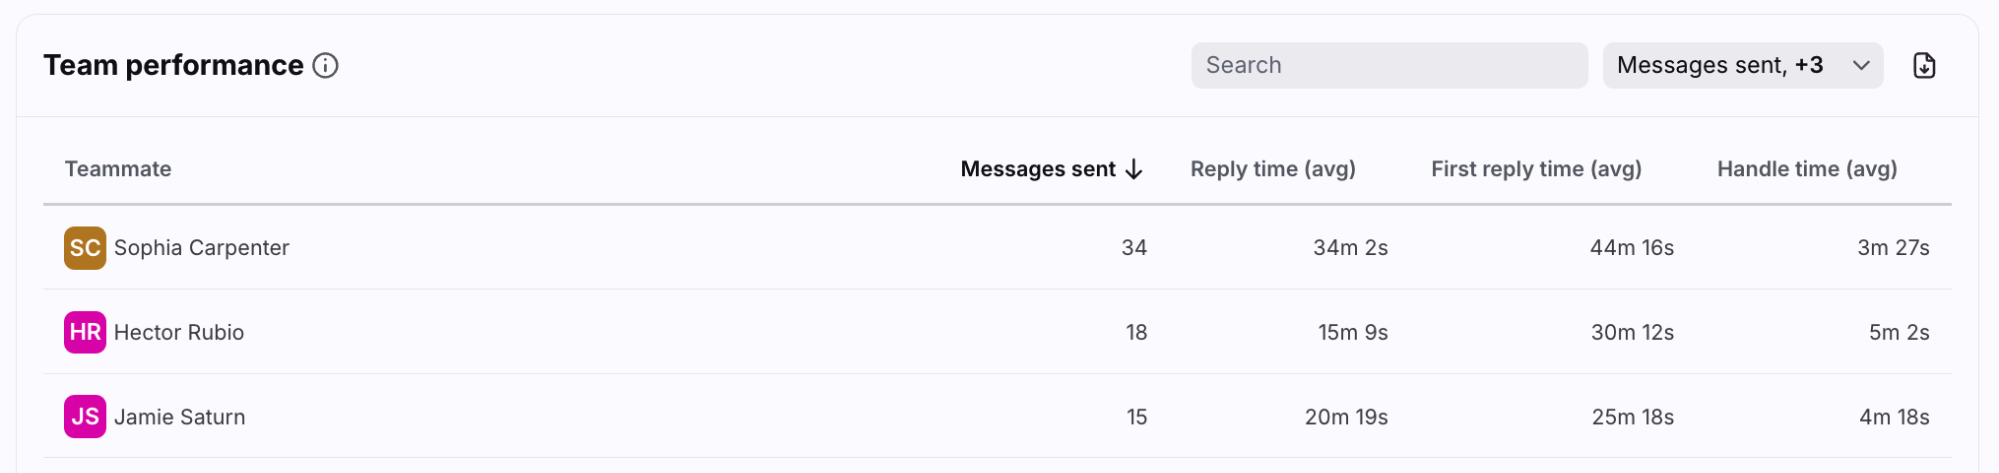
The Team performance table contains all teammates involved in the conversations selected using the report filters.
Use the search bar to find a specific teammate.
Click the dropdown at the top right of this section to select which metrics you want to display, listed below.
Customize how many rows you'd like to display on each page using the Rows per page on the bottom left.
Click the arrows and numbers on the bottom right to view additional pages.
Click on each metric to see the metric details and list of conversations counted in the metric.
List of metrics
New tasks (coming soon)
Resolved tasks (coming soon)
Task resolution time (avg) (coming soon)
Task time in ticket status (coming soon)
Overdue time goals (when assignee)
Instructions
Set up a new report view by following this guide.
Pricing
This feature is available on all the latest plans. Some legacy plans may also allow access to this feature.