Navigating Analytics
Overview
Front Analytics presents a series of simple and intuitive controls that are consistent across different reports, so that you can quickly customize each report to show the data you need. You can create different versions, or views, of each type of report and customize each view. This article will orient you in how to navigate Analytics.
Take a Front Academy course here to learn more about leveraging Front analytics to achieve your goals.
How to access Analytics
Access the Analytics section by selecting Analytics in the navigation menu. You must be a workspace admin of the workspace in order to view workspace analytics, but non-admins can access their individual analytics.
Report navigation features
The left navigation panel is where you will access the different report types available and your saved views for each report.
Workspace, company, or individual selection
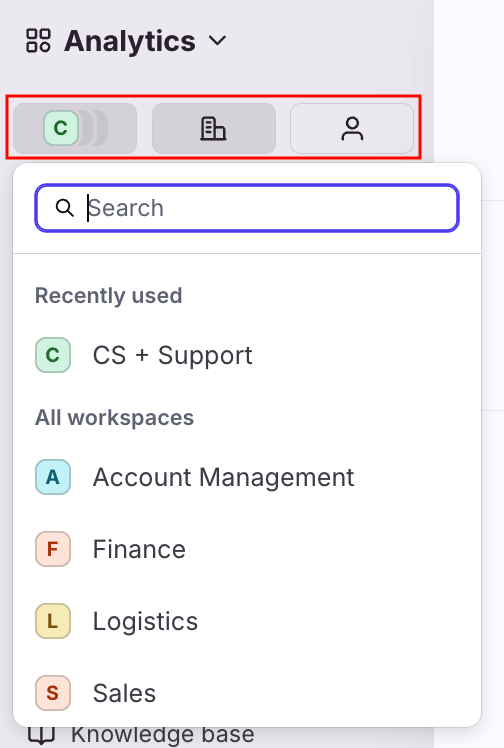
Use the dropdown menu at the top left to choose between viewing workspace, company, and individual analytics.
Workspace analytics: If you have multiple workspaces on your plan, you will see them on this list. You need to be a workspace admin or have a role with analytics permissions to view workspace analytics reports.
Company analytics: If you have multiple workspaces on your plan, you'll see the Company option in the list. Company analytics combines data across workspaces. You must be a company admin AND have workspace admin access to your workspaces to view company-wide analytics reports.
Individual analytics: Clicking Me will show your Analytics for your personal inbox, as well as actions you took in shared inboxes. All users at companies with access to Analytics have access to individual analytics.
Reports list
On the left panel of the Analytics section, you will see a list of all the report types available:
Report header features
You'll see a consistent header format on the right side after clicking on a report type from the left-side navigation panel. This report header format is the same for most report types.
Report name
On the top left, you'll see the name of the report type.
Progress bar and last updated
As the report loads, you'll see a progress percentage next to the report name. You'll see the message "Data from up to 2 hours ago" after the report fully loads. This means that all activities older than 2 hours are reflected in the report.
The exception is the Live dashboard, which displays real-time data.
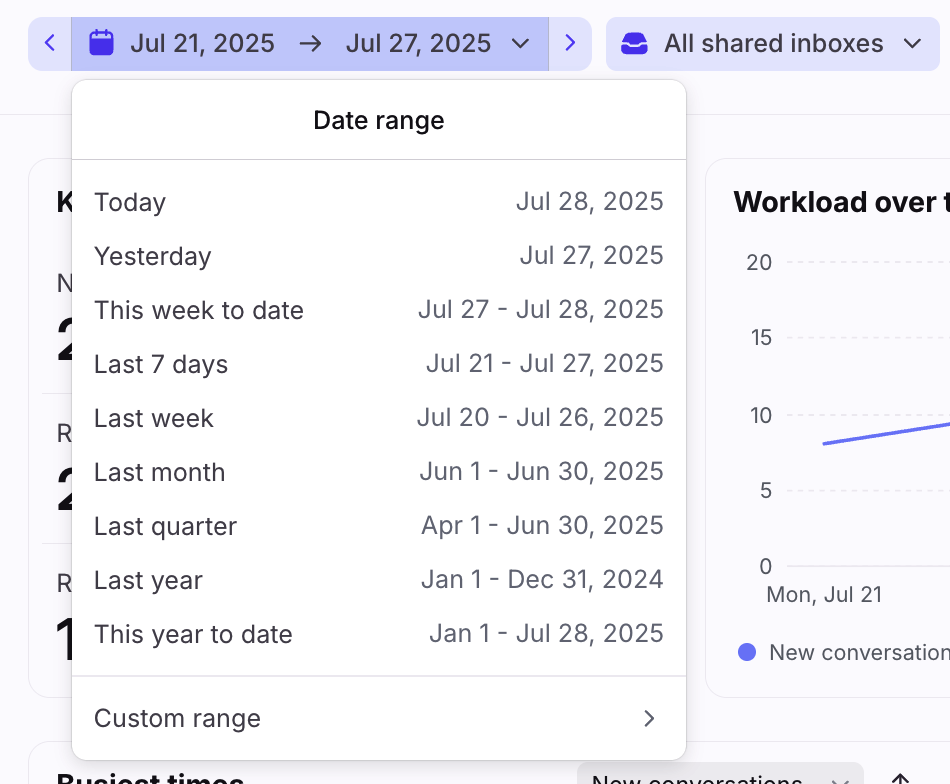
Date range
Choose the date range for the report; from day, week, month, quarter, year, or a custom range. See here for historical data limits per plan.
Views
For each report, you can create multiple views that have different filters.
Views are displayed as tabs across the top of each report if you pin them. Pinned views are unique to you and do not show for other teammates.
When you create a view for any report, it is created and visible in all the other reports you click into. The exception to this are the Chatbots and Knowledge base reports since many filters do not apply to them.
See a list of all your saved views by clicking the All views menu on the top right. Click the checkbox to pin it across the top as a tab for quick access or to view it. Click the X on the tab to unpin it.
Create a new view by clicking the Add view. You can then select the filters to customize this view, described in the section below. Learn more about creating and editing views here.
Filters
Every view for a report has several different filter options to customize exactly what you need to see for the view.
The filter options are:
Workspace (company analytics only): Filters only activities that happened in selected workspaces. The default is Company (all workspaces). This filter will not return data prior to September 2021. Use the Inboxes filter instead to narrow older data across multiple workspaces.
Inboxes: Filters only activities that happened in the selected inboxes. The default is All shared inboxes, and you may also select All individual inboxes. Note: The All individual inboxes option will only include the individual inboxes of teammates who have the Make inbox visible in the analytics setting enabled.
Teammates: Filters actions attributed to selected teammates. For the majority of metrics, this filters for data where the teammate took specific action (e.g. sent the message). For some metrics like Overdue time goals other logic is used (e.g. teammate was assigned to conversation at time of breach). For more specifics, refer to individual metric definitions in the glossary.
Channels: Filters only activities that happened in the selected channels.
Accounts (Professional plan or above): Filters conversations involving selected accounts. Note: Account data is not updated retroactively in Analytics. This means:
When viewing analytics data by accounts or filtering on a specific account, analytics metrics don’t consider events/conversations that happened before the account was created.
The association between an account and its contacts is not changed after a conversation segment is closed.
Example: If a contact is associated to an account, the contact/account information will only apply to conversations moving forward.
Tags: Filters conversations that have the selected tags. By default, tag filters will display conversations that currently include any selected tags. You can change this filter to display conversations that currently include all selected tags. You can also view conversations that ever included any selected tags, or ever included all selected tags to include conversations that had the tag any any point in time (but may have been removed).
Exclude tags: Filters conversation segments that do not currently have selected tags, or do not currently have any tags. A conversation will still be included in analytics if it has a conversation segment where the tag was not present.
Ticket statuses: Filters conversation segments that are in a particular status. Conversations need to be in an inbox with ticketing enabled.
Topics: Filters conversations that have the selected Topics.
Click More filters to select a new filter, then use the dropdown menu for the filter to choose the items you want to include. Learn more about creating and editing filters here.
You can adjust filters to immediately see the changes reflected in your view, without having to save them.
When you save the filters for a view, the set of filters for the view are applied to all the reports, since the same views are visible in all reports. However, the date range you've selected is not considered a filter, and is not saved to the view.
Export view data
You can export a CSV file with the raw data of your view by clicking the three-dot menu on the top right and selecting Export data. To learn more, see this article.
Report sections
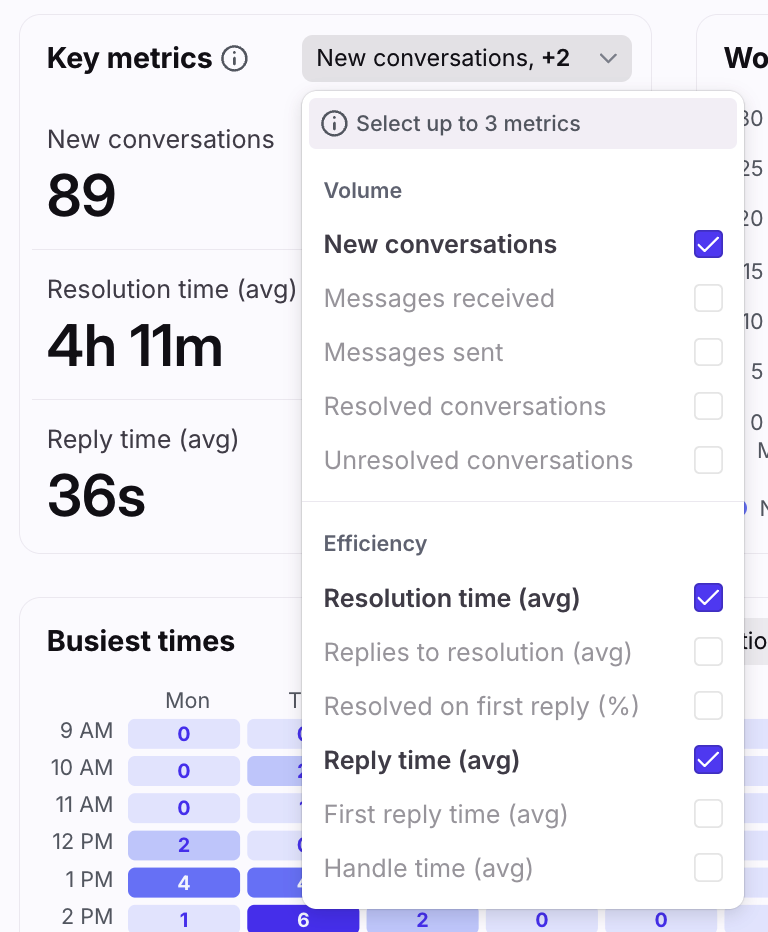
Many of the sections in the reports are customizable to include the specific metrics you want to see. Any subsection within a report that has a dropdown menu or gear icon can be customized to display the specific metrics you want to see in this subsection.
Many of the charts and tables from your reports can also be exported.
Pricing
Analytics are available on all the latest plans. The latest Starter plan has limited access. Some legacy plans may also allow access to this feature.


