
Chatbots report
Overview
The Chatbots report enables you to track performance of your chatbots and AI Answers for your Front Chat channels. You’ll be able to measure how chat visitors interact with your chatbot flows and how successfully your chatbot deflects incoming chat conversations from your team.
Check out our Front Academy course on chatbots here to learn more about leveraging value from chatbots.
Report sections
Chatbot performance table
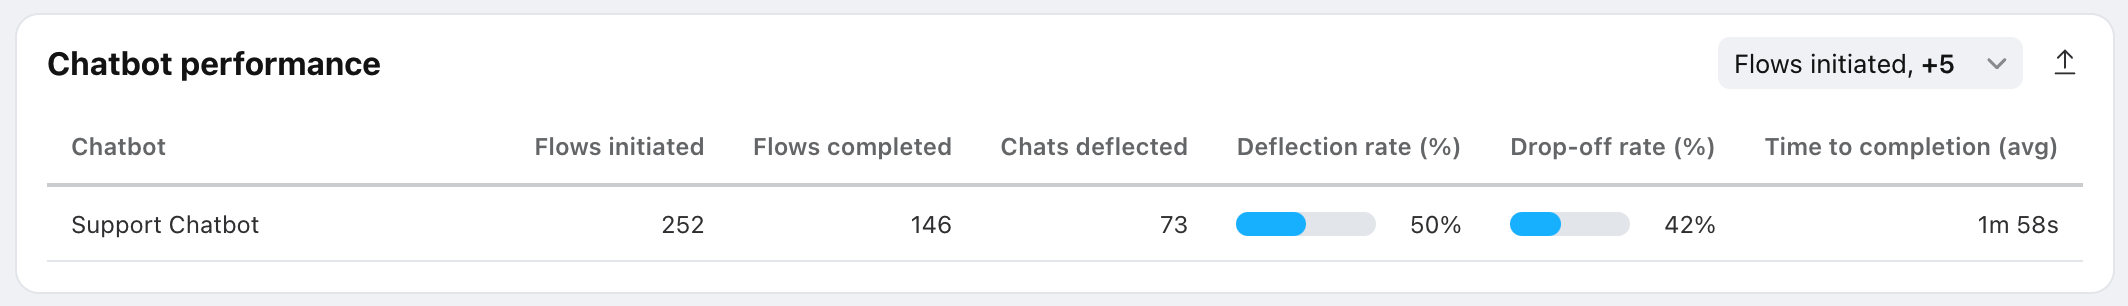
Features
Each row of this table contains metrics for the chatbot selected in the chatbot filter, listed below.
To export your chat history, click the export icon, then select Export chat history to download a list of your chatbot conversations.
Conversations are only included in the file if a chat visitor interacted with the chatbot (replied, clicked a multiple choice option, etc.), regardless if they completed the chatbot flow.
Conversations where the chat visitor opened the chat and did not do anything are excluded from the file.
List of metrics
Chatbot performance over time graph
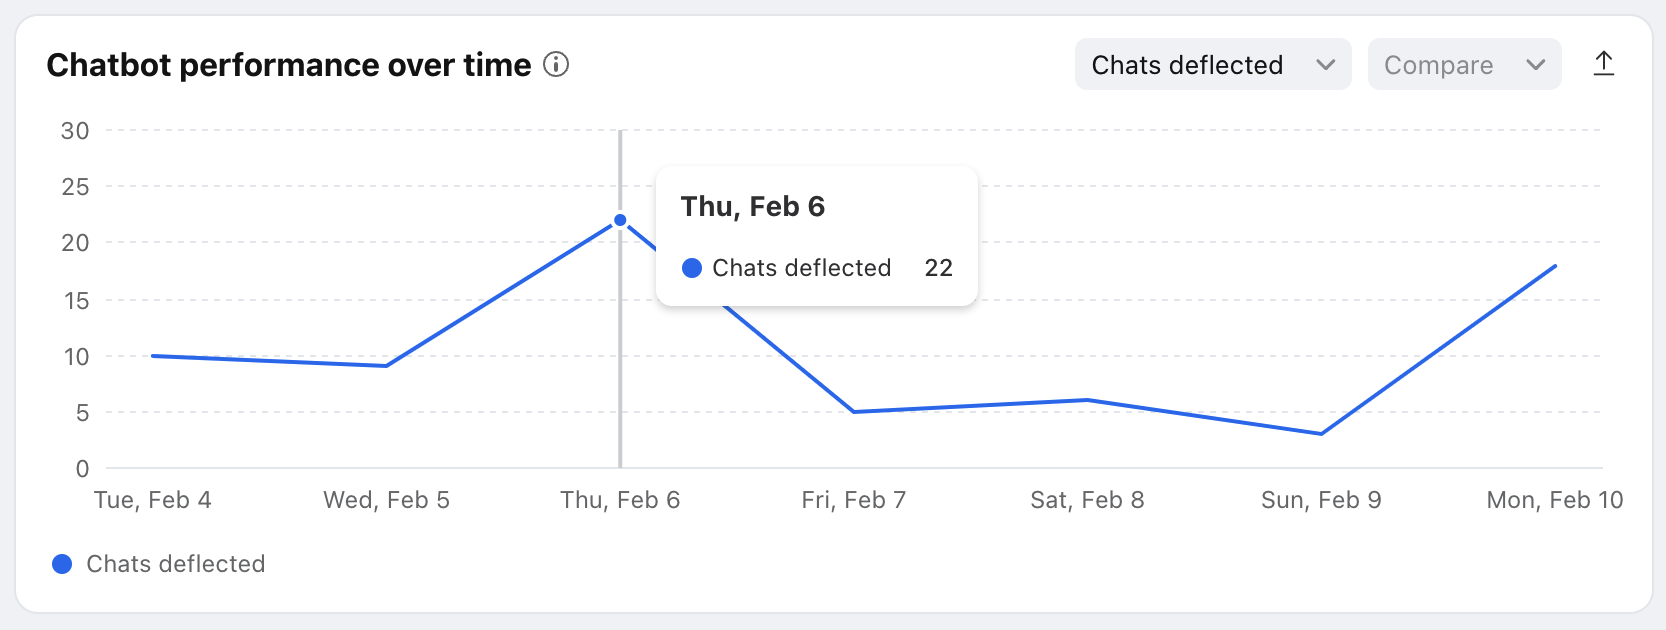
Features
The Chat performance over time graph shows the changes in your chatbot metrics over the selected time period.
Click the dropdown menu to choose the metric you want to display, listed below.
Hover over points in the line graph to see specific metrics for each time increment.
Select Compare to previous period to quickly compare the data to the previous period of the same length.
List of metrics
AI Answers table
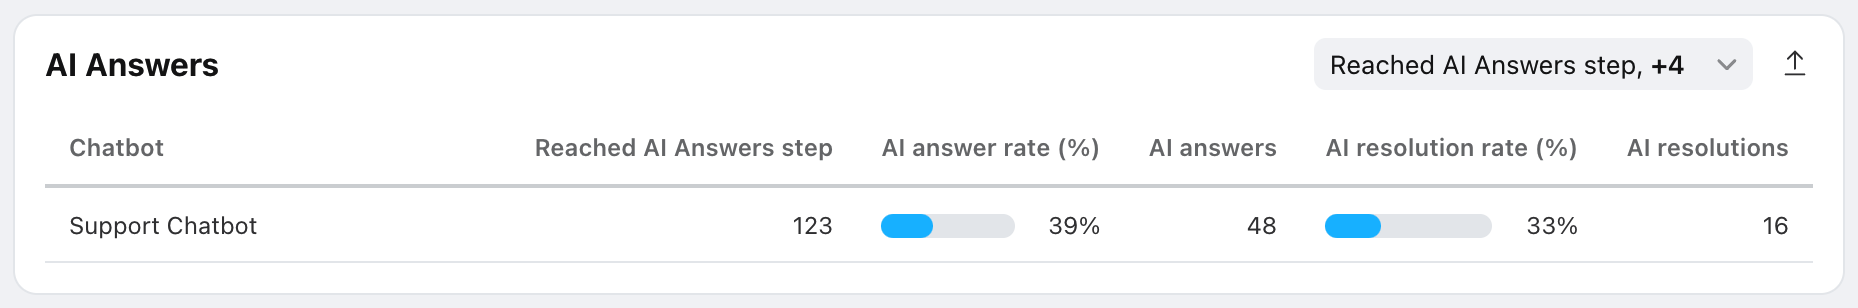
Features
Each row of this table contains metrics for the chatbots selected in the chatbots filter, listed below.
To export your AI Answers history, click the export icon, then select Export all conversations or Export all resolved conversations to download a list of conversations where AI Answers responded.
List of metrics (see glossary here)
Reached AI Answers step
AI answers
AI resolutions
AI answer rate (%)
AI resolution rate (%)
AI participation rate (%)
AI success rate (%)
AI Answers over time graph
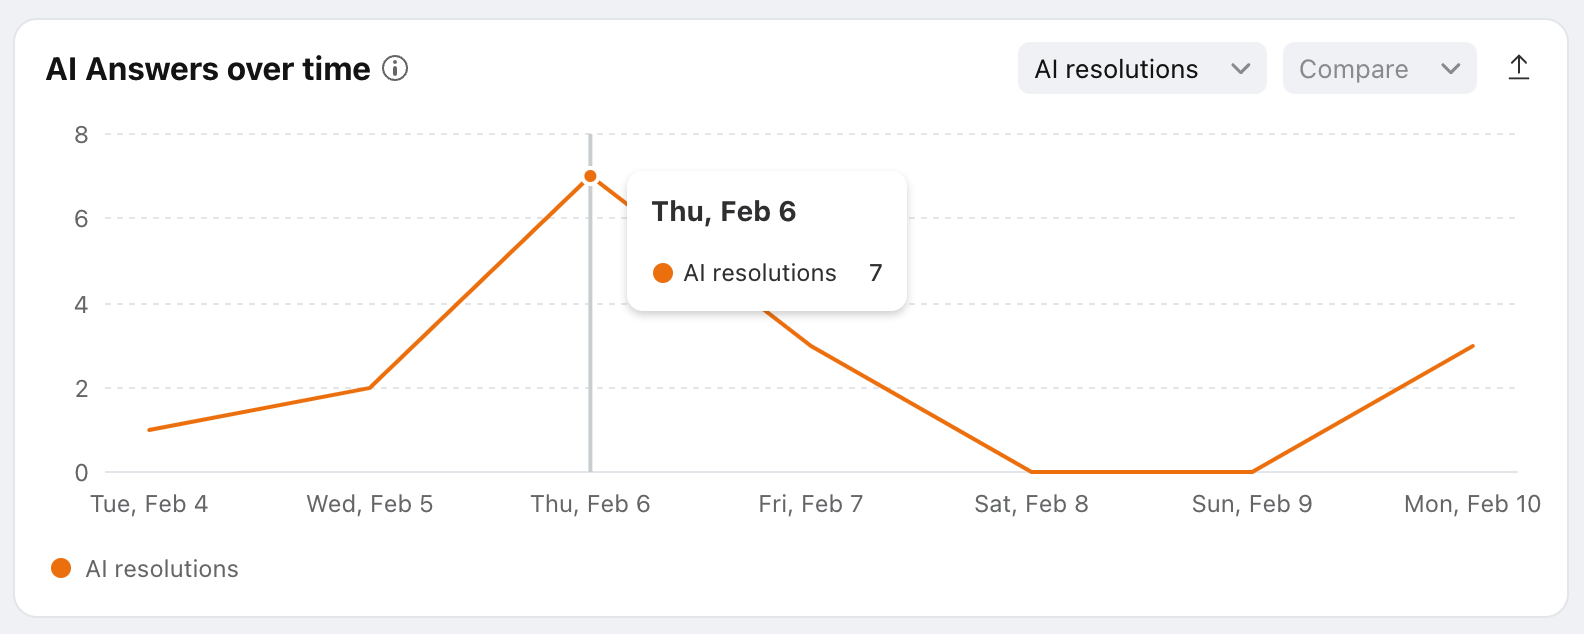
Features
The AI Answers over time graph shows the changes in your AI Answers metrics over the selected time period.
Click the dropdown menu to choose the metric you want to display, listed below.
Hover over points in the line graph to see specific metrics for each time increment.
Select Compare to previous period to quickly compare the data to the previous period of the same length.
List of metrics (see glossary here)
Reached AI Answers step
AI answers
AI resolutions
AI answer rate (%)
AI resolution rate (%)
AI participation rate (%)
AI success rate (%)
Instructions
Filters

Date filter: Select the dates you’d like to view analytics for
Chatbot selector: Select the chatbot you’d like the report to include. You can select any chatbot available in your workspace. Only one chatbot can be selected at a time.
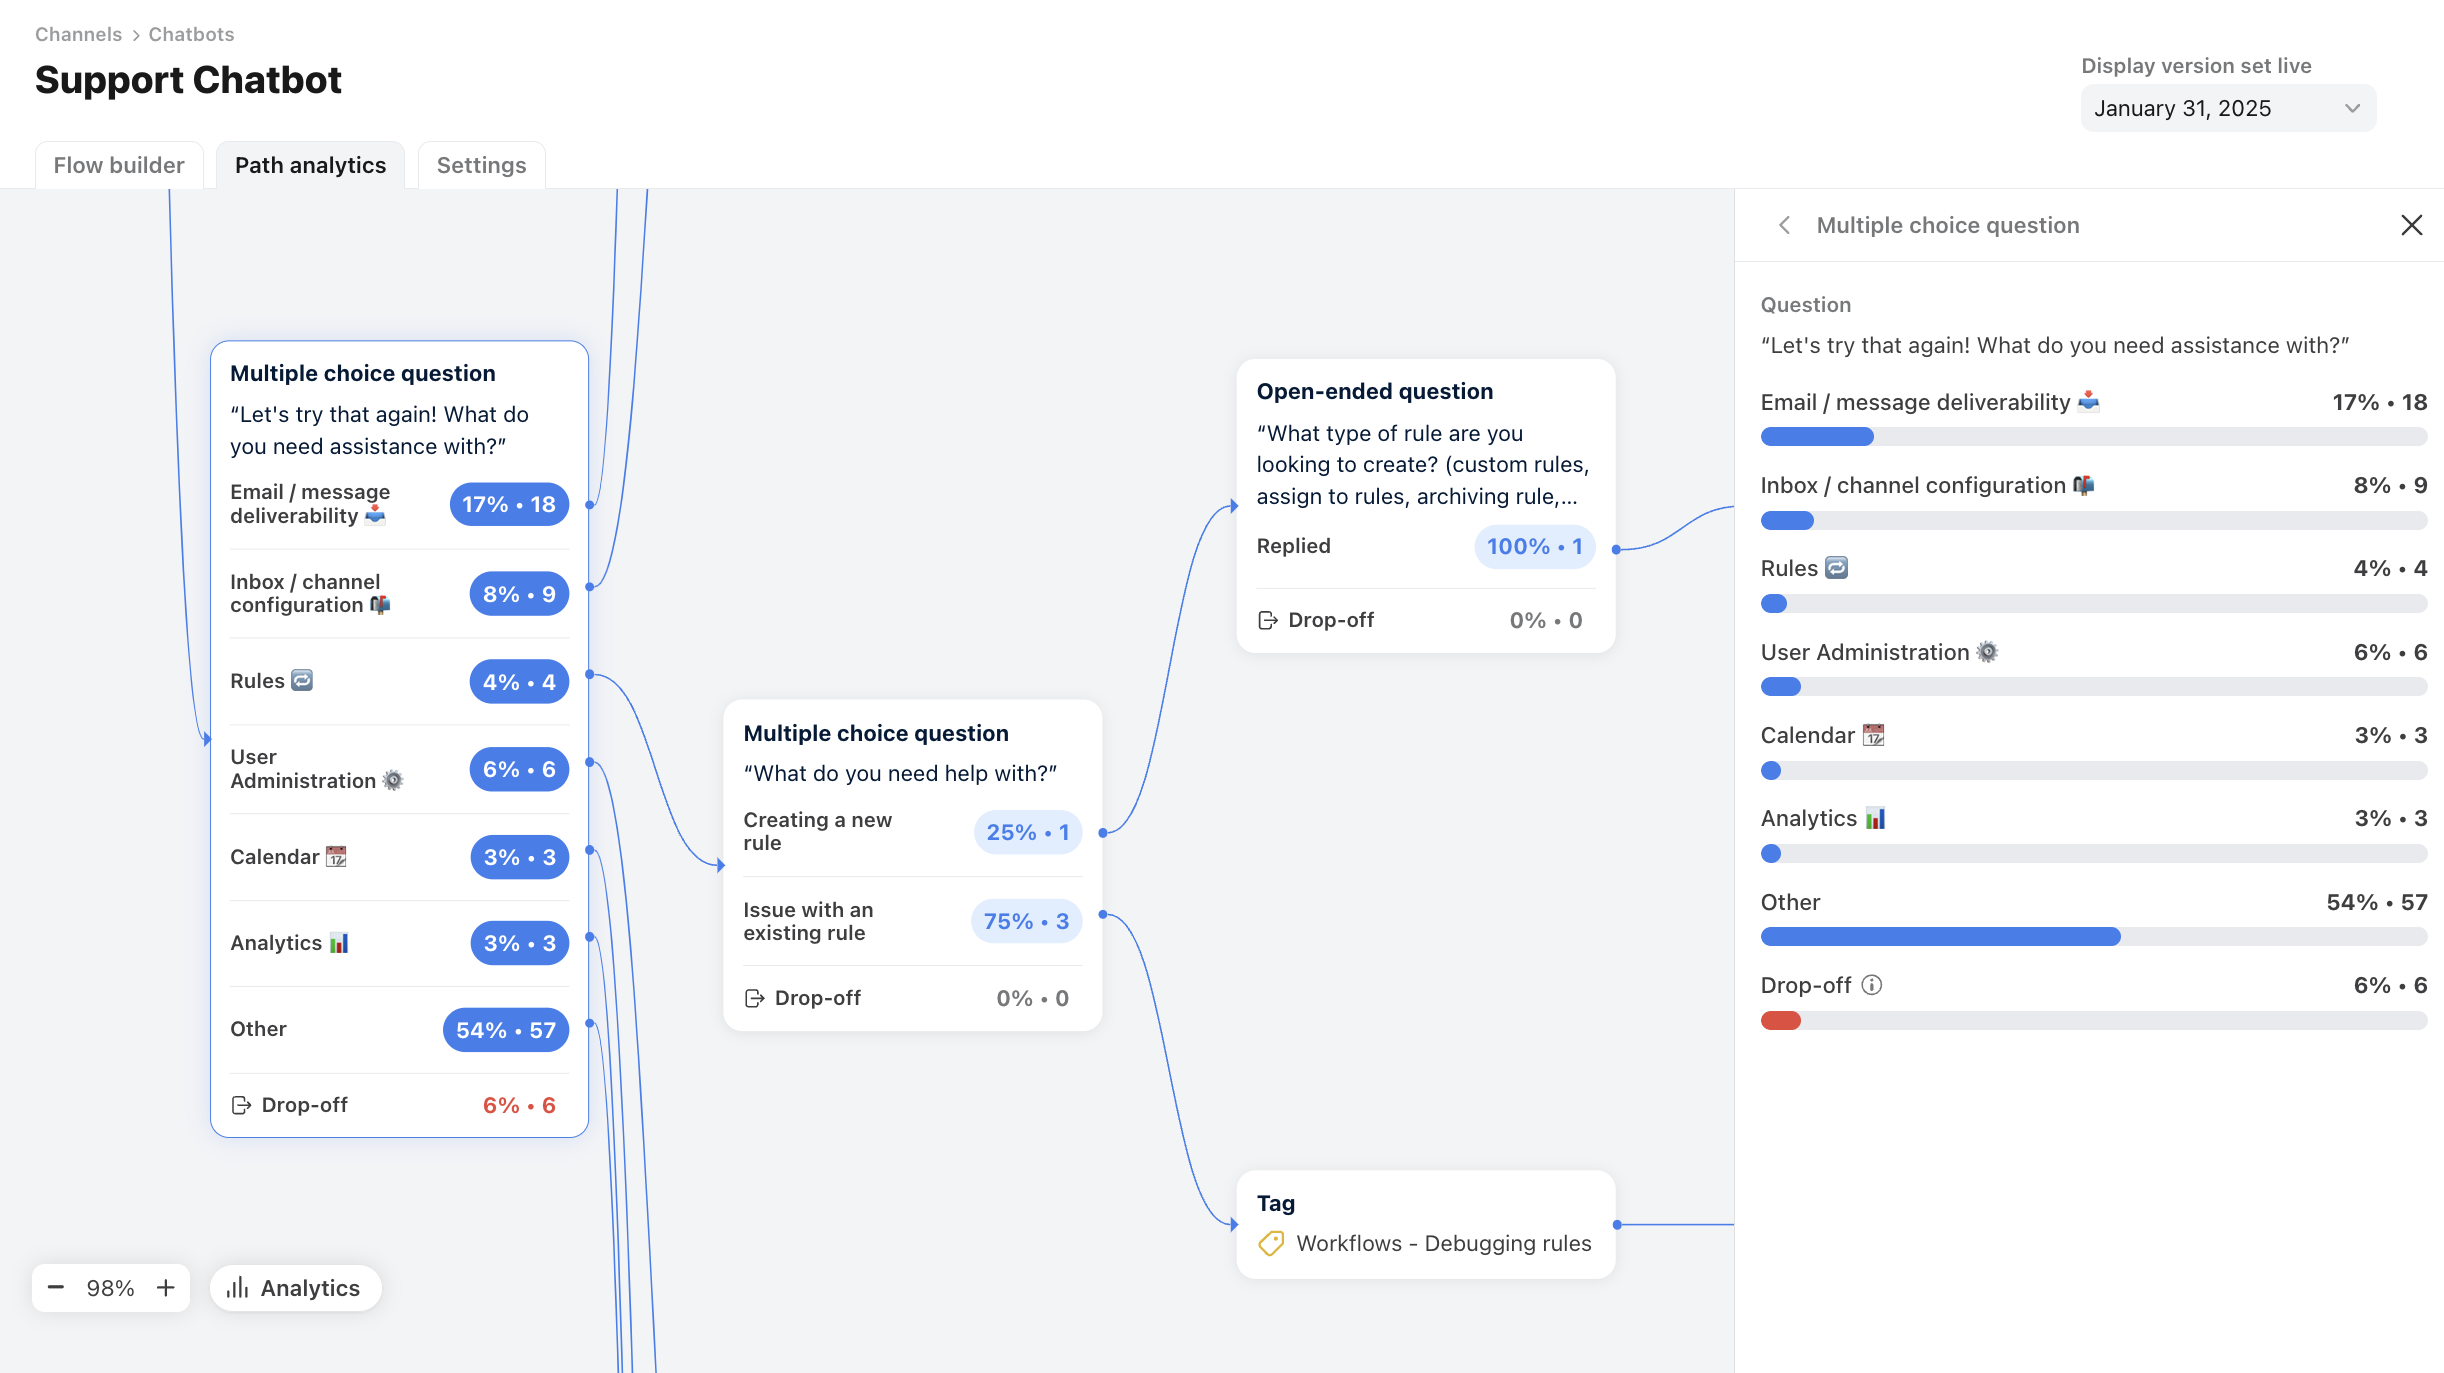
Path analytics
Click the Go to path analytics button at the top to drill down and review volume and drop-off rates for each visitor step in your chatbot flow. See this article to learn more.
Views
Unlike other reports, views are not available for the Chatbots report because many filters available on other reports are not relevant for chatbots.
Analytics exports
Exporting data is currently only available for the individual charts, not for the entire Chatbots report.
Pricing
This feature is available on the latest Professional plan or above. Some legacy plans may also allow access to this feature.