
Workload report
Overview
The Workload report is the go-to place to understand if your team is sufficiently staffed to handle the volume of conversations and to reach your efficiency goals. You can track workload by inboxes over time, along with resolution and reply times.
Take a Front Academy course here to learn more about leveraging Front analytics to achieve your goals.
Report sections
Key metrics chart
Features
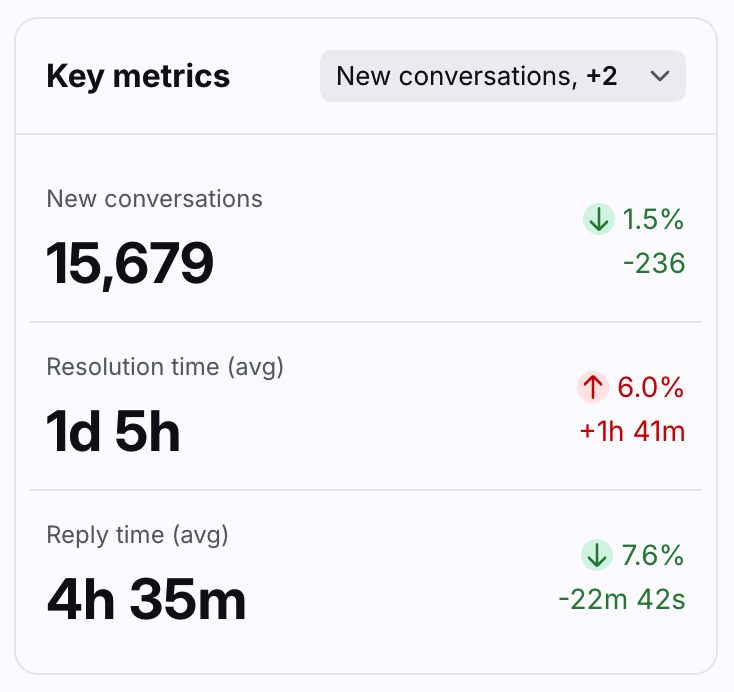
Up to three Key metrics cards are featured here to help you understand your workload at a glance.
Click the dropdown at the top right of this section to select which metrics you want to display, listed below.
Each card displays the name of the metric, the current measurement, and the variation compared to the previous period of the same length.
Variations for metrics in percentages are shown in percentage points (“pp”), which is the arithmetic difference between two percentages. For example, moving down from 36% to 34% is a decrease of 2 percentage points.
Click on each metric to see the metric details and list of conversations counted in the metric.
List of metrics
*Ticket statuses must be enabled to view these metrics. If your workspace has an active conversation stages rule, your metrics will be based on conversation stages instead. See this article to learn more.
Workload over time graph
Features
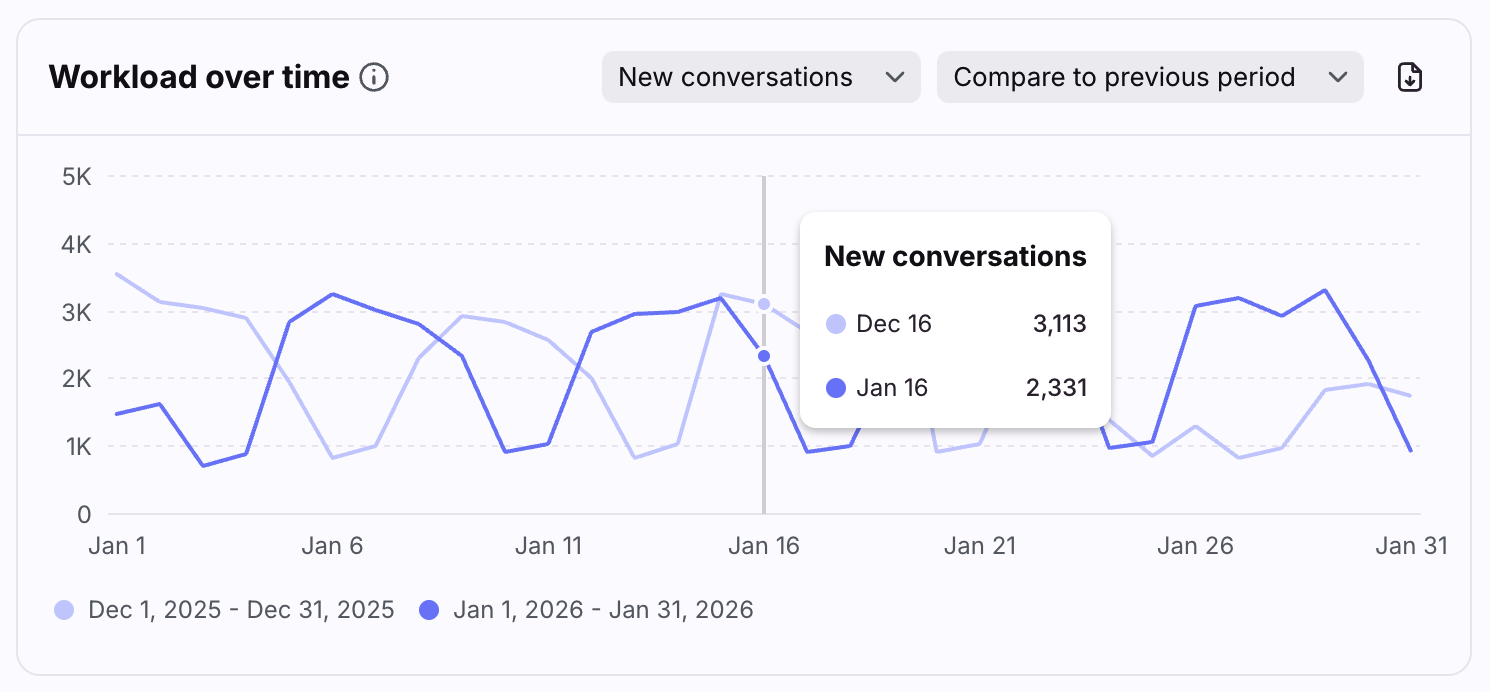
The Workload over time graph allows you to identify volume peaks or efficiency drops to adapt staffing and make sure your team can handle the workload.
Click the metrics dropdown at the top right of this section to select which metrics you want to display, listed below.
Click the Compare dropdown at the top right of this section and select from the following options:
Compare to previous period: Display values from the previous period.
Group by inbox (top 5) or Group by tag (top 5): Display values for the top 5 inboxes or tags selected in your report. This allows you to drill down to understand outliers, trends, and compare your workload across inboxes or tags.
Hover over points in the line graph to see the selected metric for each time increment.
Click on a point on the line graph to see the metric details and list of conversations counted in the metric.
List of metrics
*Ticket statuses must be enabled to view these metrics. If your workspace has an active conversation stages rule, your metrics will be based on conversation stages instead. See this article to learn more.
Busiest times heatmap
Features
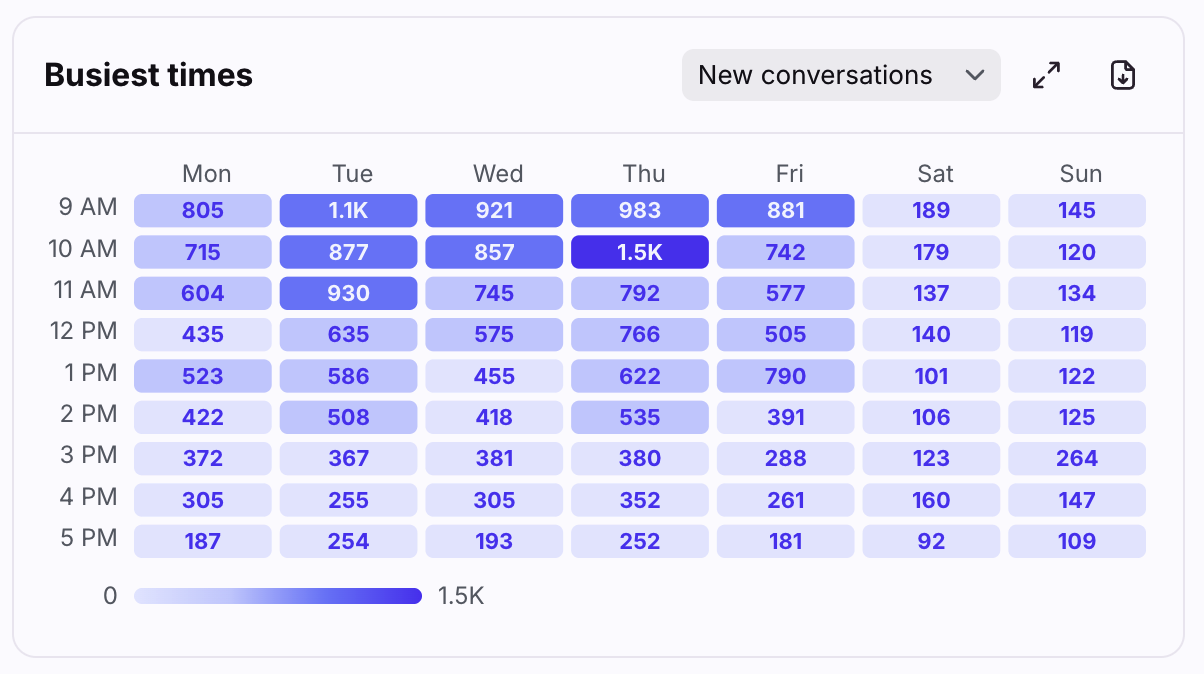
The Busiest times heatmap helps you identify times during the week with the most workload to manage your team's shifts.
Click the metrics dropdown at the top right of this section to select which metric you want to display, listed below.
A color legend on the bottom left shows the range for the metric, with darkest being the most busy.
The heatmap shows hours from 9AM to 5PM by default based on the time zone set in your preferences. To see all 24 hours, click the expand icon in the top right.
Click on each metric to see the metric details and list of conversations counted in the metric.
List of metrics
*Ticket statuses must be enabled to view these metrics. If your workspace has an active conversation stages rule, your metrics will be based on conversation stages instead. See this article to learn more.
Efficiency chart
Features
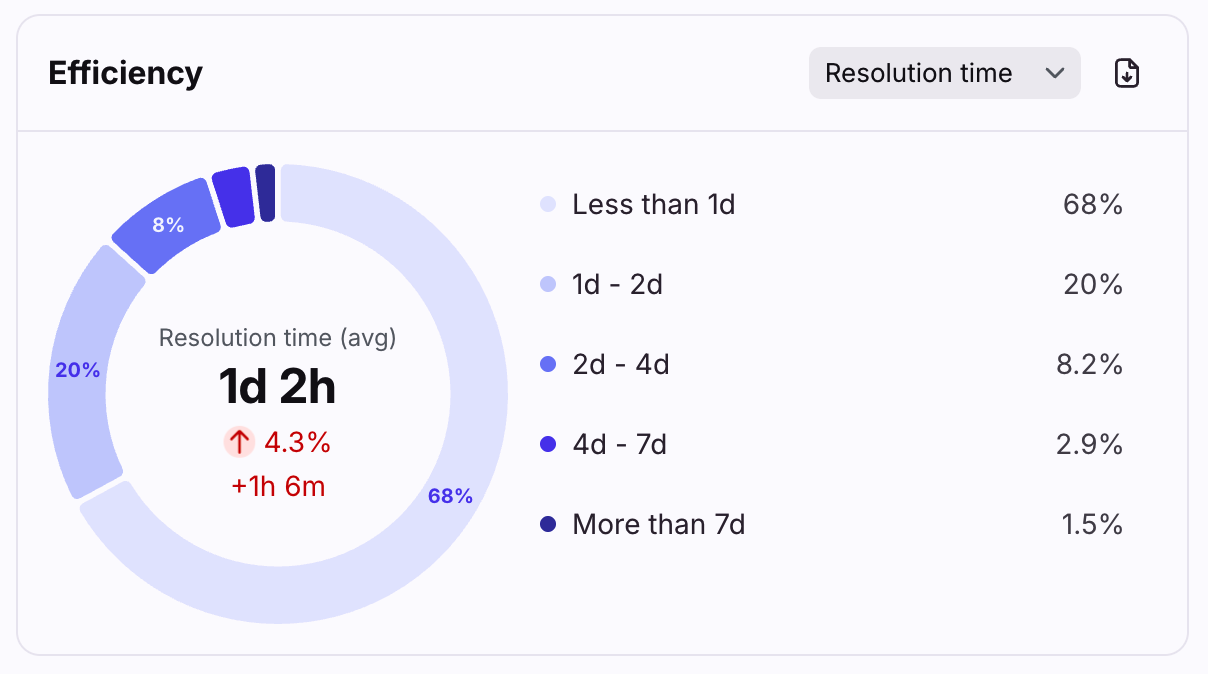
The Efficiency chart helps you investigate the most and least efficient conversations to identify improvement opportunities.
Click the metrics dropdown at the top right of this section to select which metric you want to display, listed below.
Click on a metric interval to see the metric details and list of conversations counted in the metric.
List of metrics
*Ticket statuses must be enabled to view these metrics. If your workspace has an active conversation stages rule, your metrics will be based on conversation stages instead. See this article to learn more.
Conversation stages chart [legacy]
Features
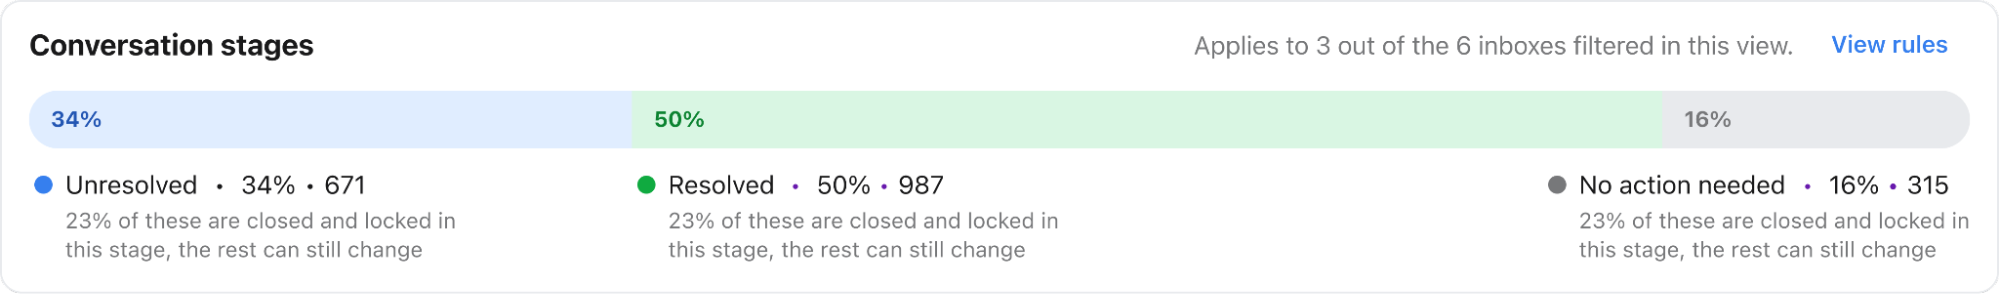
The Conversation stages chart shows the breakdown between Unresolved, Resolved, and No action needed conversation segments. It helps you identify which conversations are blocked (Unresolved) and investigate why.
Only conversation segments that were active during the time period will be included in the chart. e.g. The segment had at least one activity like a message, comment, tag, assignment, etc.
The chart will also indicate the percentage of conversation segments that are closed and locked within each stage.
The Conversation stages chart will only include data from inboxes that have conversation stages enabled in rules. To learn how to enable conversation stages, see this article.
Be careful when using inbox filters at the top of your report. For example, if you filter your report on 6 inboxes, but only 3 inboxes have conversation stages enabled, you will see the conversation stage data from those 3 inboxes. This is indicated by the warning "Applies to 3 out of the 6 inboxes filtered in this view."
To review which inboxes have conversation stages enabled, click View rules to see the list of conversation stage rules. Click into the rule(s) to check which inboxes they apply to.
Click on each metric to see the metric details and list of conversations counted in the metric.
List of metrics
*Conversation stages must be enabled to use these metrics
Workload by inbox table
Features
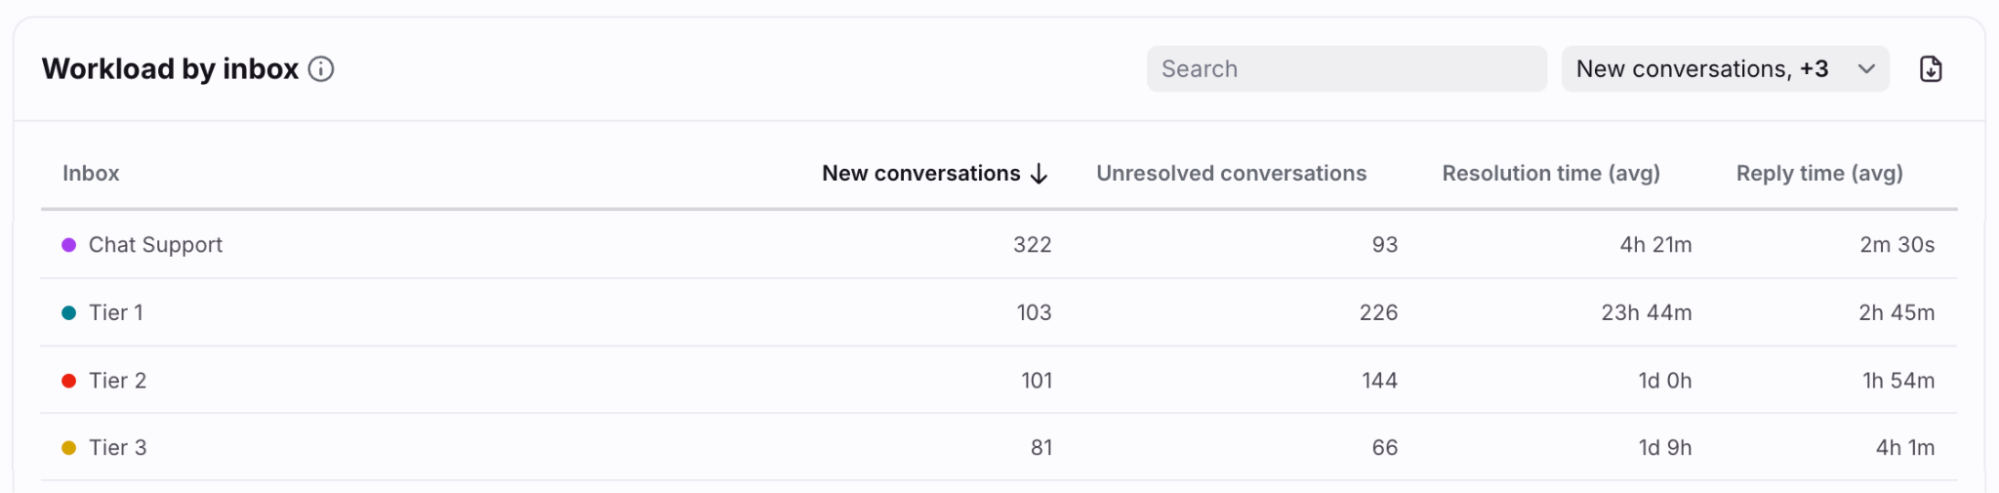
The Workload by inbox table allows you to compare volume metrics by inboxes to identify outliers.
Customize how many rows you'd like to display on each page using the Rows per page dropdown on the bottom left.
Click the arrows and numbers on the bottom right to view additional pages.
Click on each metric to see the metric details and list of conversations counted in the metric.
List of metrics
New tasks (coming soon)
Resolved tasks (coming soon)
Task resolution time (avg) (coming soon)
*Ticket statuses must be enabled to view these metrics. If your workspace has an active conversation stages rule, your metrics will be based on conversation stages instead. See this article to learn more.
Pricing
This feature is available on all the latest plans. Some legacy plans may also allow access to this feature.