
Overview report [legacy feature]
⚠️ This is a legacy feature. The Overview report will no longer be updated and is replaced by the Workload report. The Overview report will be sunset and removed from scheduled analytics reports in March 2026.
Overview
As the homepage for analytics, the Overview report provides summary-level team communication insights displayed through customizable sections, described below. The report helps you understand changing business conditions so you can make decisions. They can be used to identify trends, measure the impact of your team efforts, and more.
Take a Front Academy course here to learn more about leveraging Front analytics to achieve your goals.
Report sections
Main Metrics cards
Features
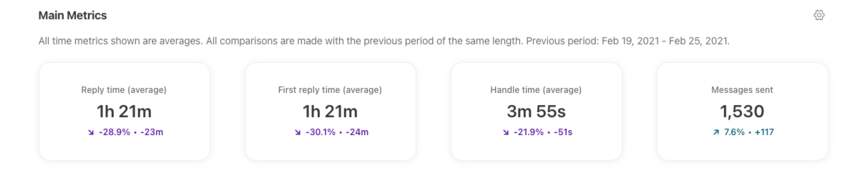
The Main Metrics cards features up to four metrics of your choosing from the full list of metrics to create a dashboard relevant to your work.
Click the gear icon at the top right of this section to select which metrics you want to display, listed below.
Click on each metric to see the metric details; how it was calculated and which conversations were counted into the metric.
When filtering the report by a specific teammate, the resolution metrics will include conversations where the teammate is the assignee. This will be improved in the future to include conversations the teammate answered and archived, but does not have to be the assignee.
List of metrics
*Ticket statuses must be enabled to view these metrics. If your workspace has an active conversation stages rule, your metrics will be based on conversation stages instead. See this article to learn more.
Conversation stages chart
Features
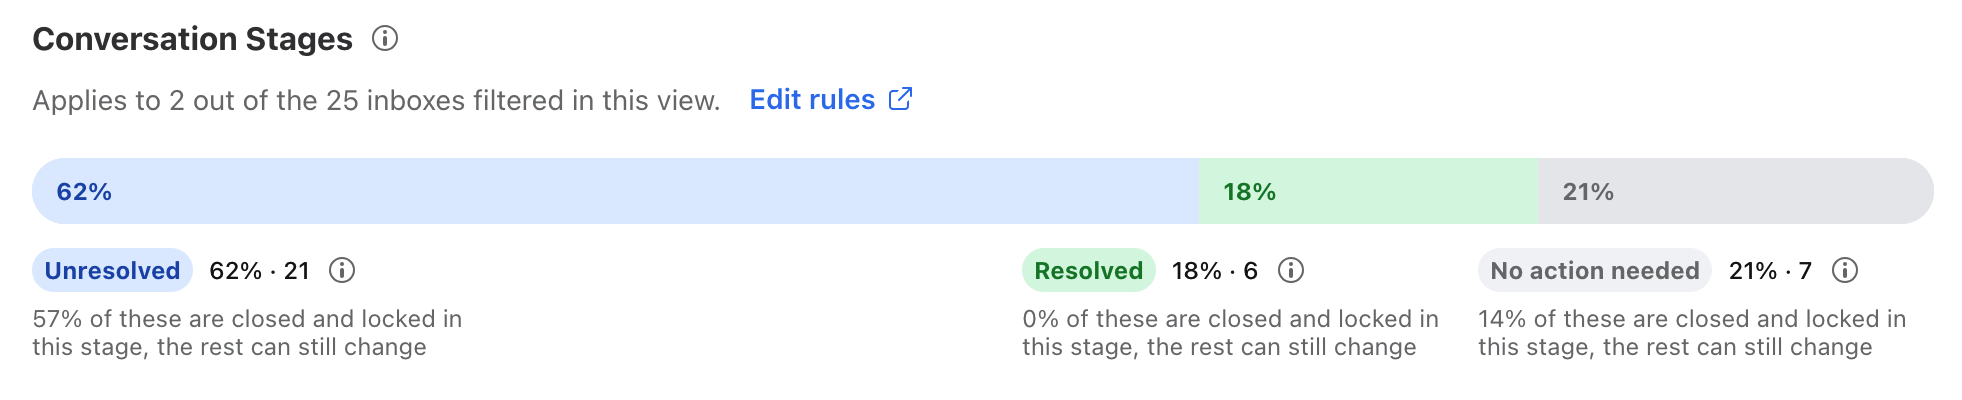
The Conversation stages chart shows the breakdown between Unresolved, Resolved, and No action needed conversation segments.
Only conversation segments that were active during the time period will be included in the chart. e.g. The segment had at least one activity like a message, comment, tag, assignment, etc.
The chart will also indicate the percentage of conversation segments that are closed and locked within each stage. To review how conversation segments close, read more here.
When filtering the Overview report by inboxes, the resolution metrics will only include data from inboxes enabled in your conversation stages settings.
Example: If you filter the Overview report for 6 inboxes, but only 3 inboxes have conversation stages enabled, then you will see the warning “Applies to 3 out of the 6 inboxes filtered in this view.”
Be careful when filtering your Overview report by inboxes, since resolution metrics will only include data from inboxes enabled in conversation stage settings.
List of metrics
*Conversation stages must be enabled to view these metrics
Changes Over Time chart
Features
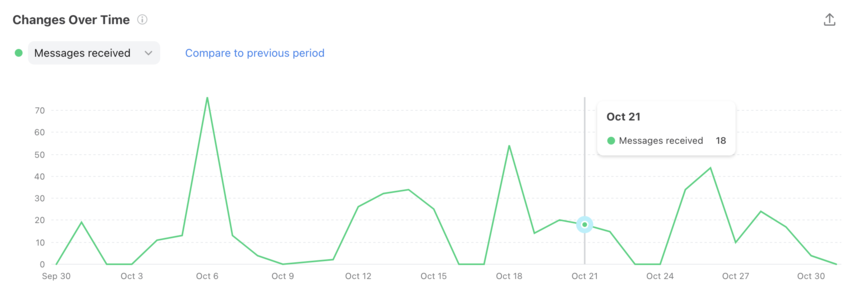
The Changes Over Time line graph that shows the changes in several key metrics over time.
Click the dropdown menu to choose the metric you want to display, listed below.
Hover over points in the line graph to see specific metrics for each time increment.
Click on a point on the graph to see the metric details; how it was calculated and which conversations were counted into the metric.
Click Compare to previous period to quickly compare the data to the previous period of the same length.
Depending on the date range selected, this chart will display by hour, week, day, or month.
List of metrics
*Ticket statuses must be enabled to view these metrics. If your workspace has an active conversation stages rule, your metrics will be based on conversation stages instead. See this article to learn more.
Replies chart
Features
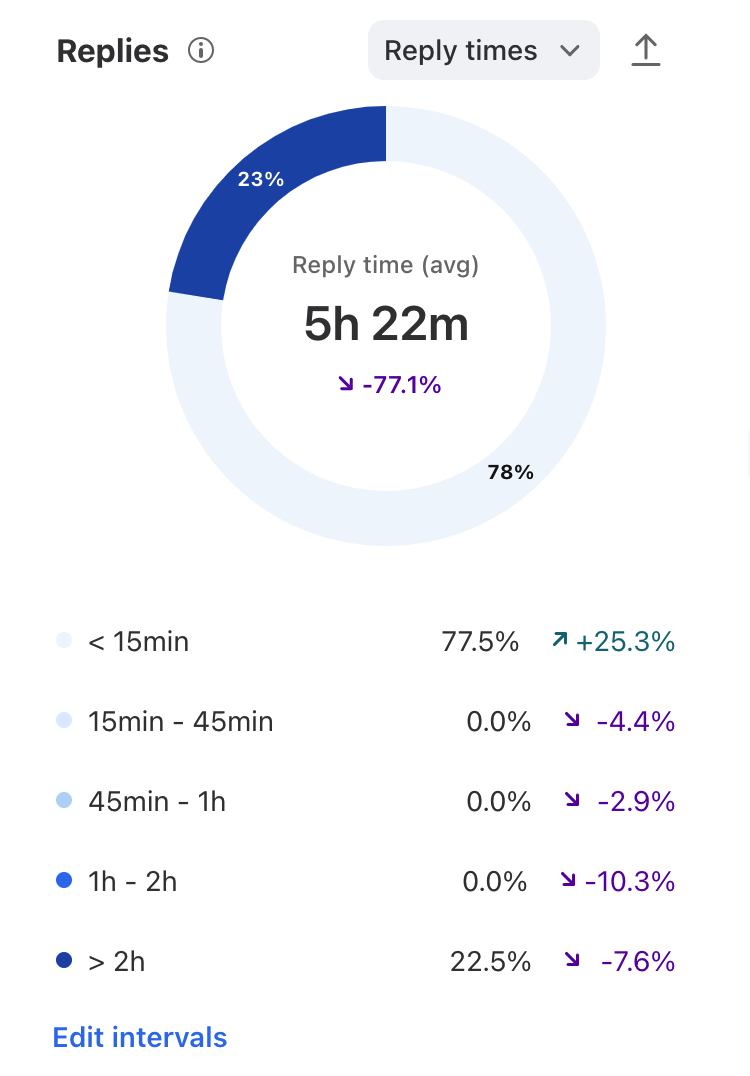
The Replies doughnut chart and the key below help you understand what proportion of conversations were replied to for each reply time increment you've defined.
The average reply time displays in the center of the chart.
Click the dropdown menu to choose the metric you want to display, listed below.
To configure your reply time buckets, click Edit intervals to open the Configure intervals menu. Enter your time increments, and click Apply.
Click on any bar in the chart to see the metric details, allowing you to view which conversations were counted into the metric.
List of metrics
*Ticket statuses must be enabled to view these metrics. If your workspace has an active conversation stages rule, your metrics will be based on conversation stages instead. See this article to learn more.
Workspace list
Features
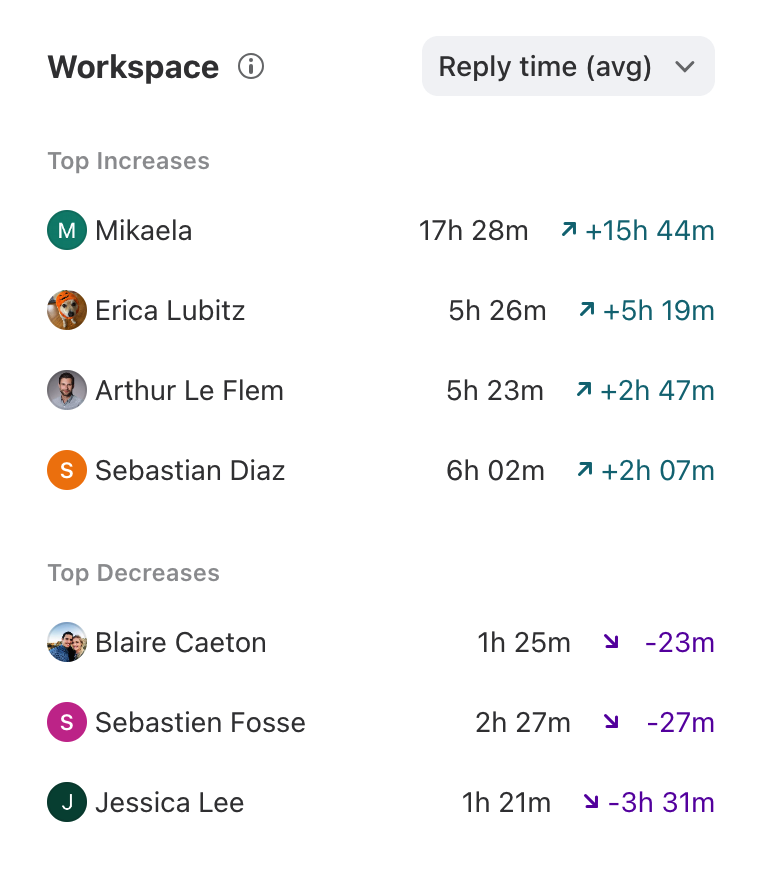
The Workspace list will display a list of teammates and the key increases and decreases per specific metric.
Open the dropdown list to toggle to the different metrics, listed below.
List of metrics
Top Tags list
Features
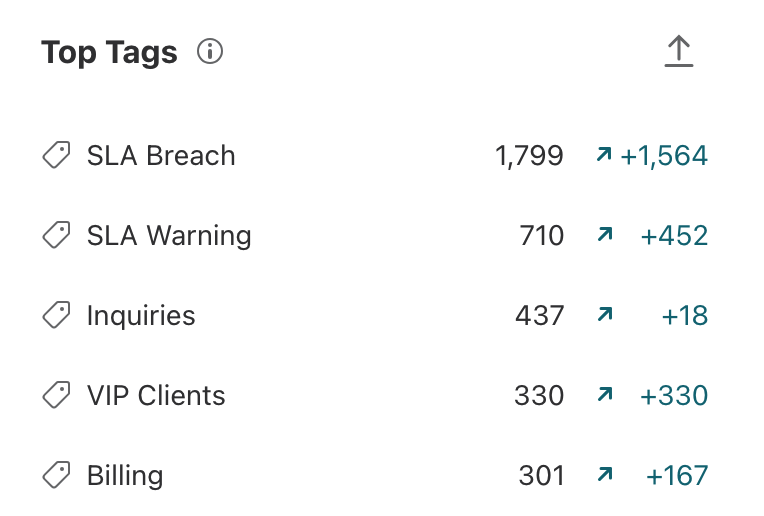
The Top tags list displays a list of the most popular tags used, the number of Active conversations associated with the tag during the time period, and the percentage change compared to the previous period.
Click on the tag to see the metric details; how it was calculated and which conversations were counted into the metric.
List of metrics
Instructions
Set up a new report view by following this guide.
Pricing
This feature is available on the latest Professional plan or above. Some legacy plans may also allow access to this feature.