
Agents report
Overview
The Agents report gives teams a comprehensive look at all AI agent activity. Use the report to evaluate resolution data, customer satisfaction and engagement, and performance over time for all agents across your workspaces. The Agents report splits resolved conversations into three exclusive buckets — agent-only, teammate-only, and hybrid — so teams can see how much of their volume the AI agent handles on its own.
Note: Legacy Autopilot data is excluded from this report.
Report sections
Key metrics chart
Features
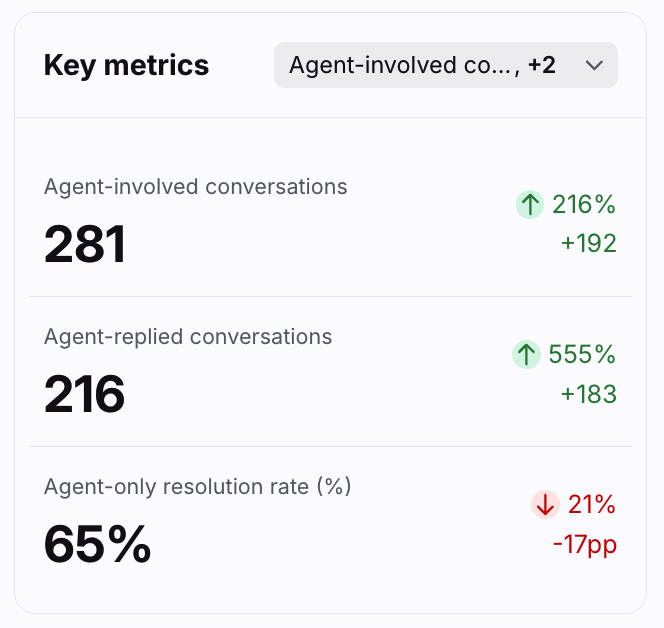
Up to three key metrics cards are featured here to help you understand your AI agent activity at a glance.
Click the dropdown at the top right of this section to select which metrics you want to display, listed below.
Each card displays the name of the metric, the current measurement, and the variation compared to the previous period of the same length.
Variations for metrics in percentages are shown in percentage points, which is the arithmetic difference between two percentages. For example, moving down from 36% to 34% is a decrease of 2 percentage points.
Click on each metric to see the metric details and list of conversations counted in the metric.
List of metrics
CSAT score breakdown chart
Features
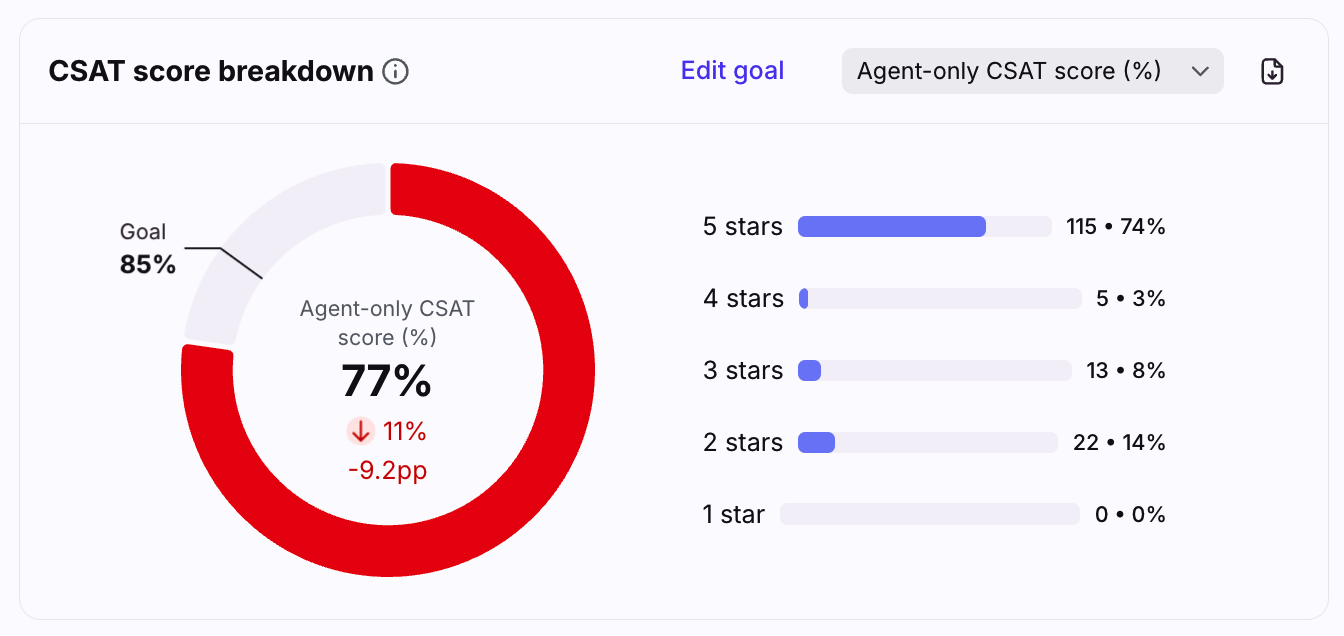
The CSAT score breakdown chart shows the breakdown of your customer CSAT and Smart CSAT ratings, and displays the CSAT score in comparison to your CSAT goal. The key is listed to the right of the chart.
Hover over the chart and click Edit goal to adjust the CSAT goal for your team. The default is 85%.
The chart displays green when the CSAT goal is met, and displays red when the goal is not met.
Click on each star rating to see which conversations were counted into the metric.
List of metrics
Agents over time table
Features
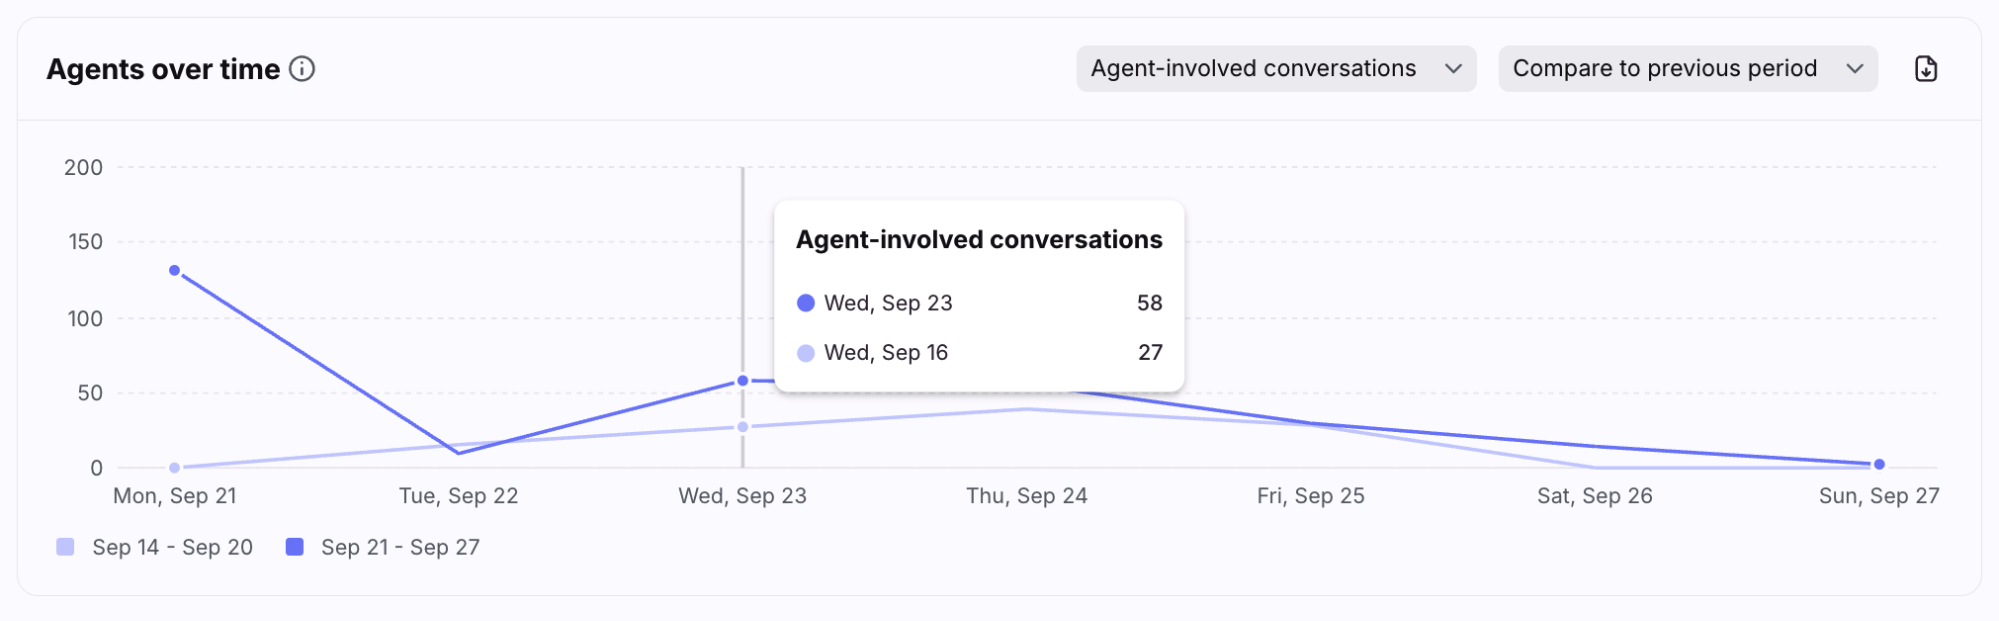
The Agents over time graph allows you to see peaks or drops to help you identify trends in AI agent activity.
Click the metrics dropdown at the top right of this section to select which metrics you want to display, listed below.
Click the Compare dropdown at the top right of this section and select Compare to previous period to display values from the previous period.
Hover over points in the line graph to see the selected metric for each time increment.
Click on a point on the line graph to see the metric details and list of conversations counted in the metric.
List of metrics
Agent details table
Features
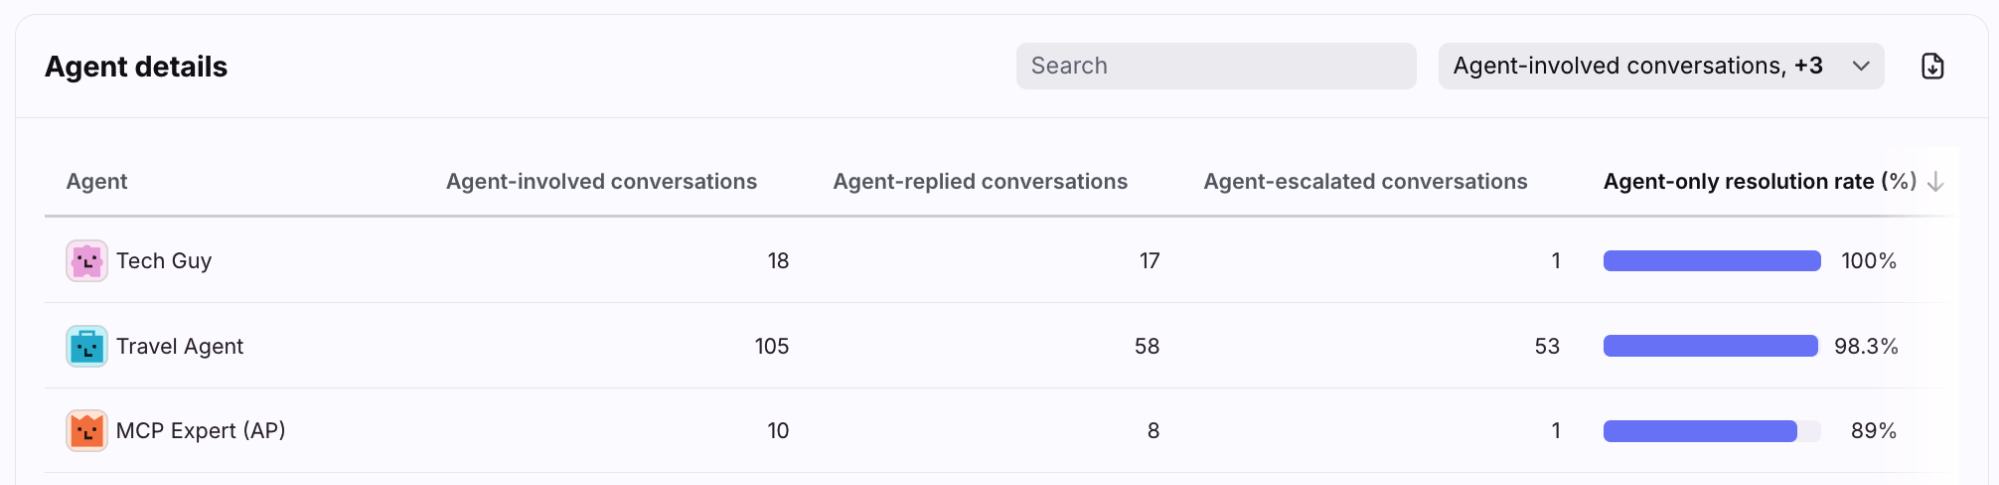
The Agent details table contains all AI agents involved in the conversations selected using the report filters.
Click on the agent’s name to open the agent details pop-up. Admins can click Edit agent to navigate to the agent’s Settings tab, or click the graph icon to navigate to the agent’s Performance tab.
Click the dropdown at the top right of this section to select which metrics you want to display, listed below.
Click on each metric to see the metric details and list of conversations counted in the metric.
List of metrics
Pricing
This feature is available on the Professional plan or above.