Time goals report
Overview
The Time goals report (previously SLAs report) measures your reply time metrics by the specific rule, times, and statuses so that you can identify the missed goals you should invest in. You will be able to understand the performance of your goals based on the time limits you've set and the number of overdue conversations. You'll first need to set up time goal rules in order to use this report.
Take a Front Academy course here to learn more about leveraging Front analytics to achieve your goals.
Overdue time goal definition
How does Front identify an overdue time goal?
Time goal reports are linked to time goal rules. With these time goal rules, a tag is added each time a conversation exceeds its time goal. The Time goal report counts an overdue conversation each time it is tagged with the overdue tag within the time period of the report. Removing the overdue tag from the conversation does not impact this, as the overdue time goal will still be counted by the Time goal report.
Example
The time goal rule VIP customers adds the Time goal overdue tag on a conversation on April 7th. You reply right after it's added and the Time goal overdue tag is removed automatically.
If your time goal report time period is:
April 6th to April 8th: the conversation counts as an overdue time goal for the report.
April 8th to April 20th: the conversation does not count as an overdue time goal. The overdue time goal happened before the time period requested.
Report sections
Key metrics chart
Features
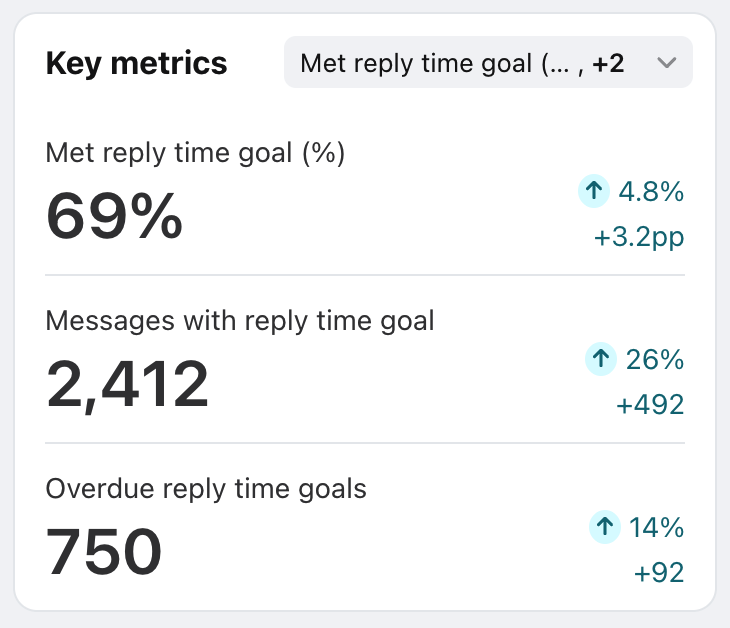
Up to three Key metrics are featured here to help you understand your efficiency at a glance.
Click the dropdown at the top right of this section to select which metrics you want to display, listed below.
Each card displays the name of the metric, the current measurement, and the variation compared to the previous period of the same length.
Variations for metrics in percentages are shown in percentage points (“pp”), which is the arithmetic difference between two percentages. For example, moving down from 36% to 34% is a decrease of 2 percentage points.
Click on each metric to see the metric details; how it was calculated and which conversations were counted into the metric.
List of metrics
Time goal performance over time graph
Features
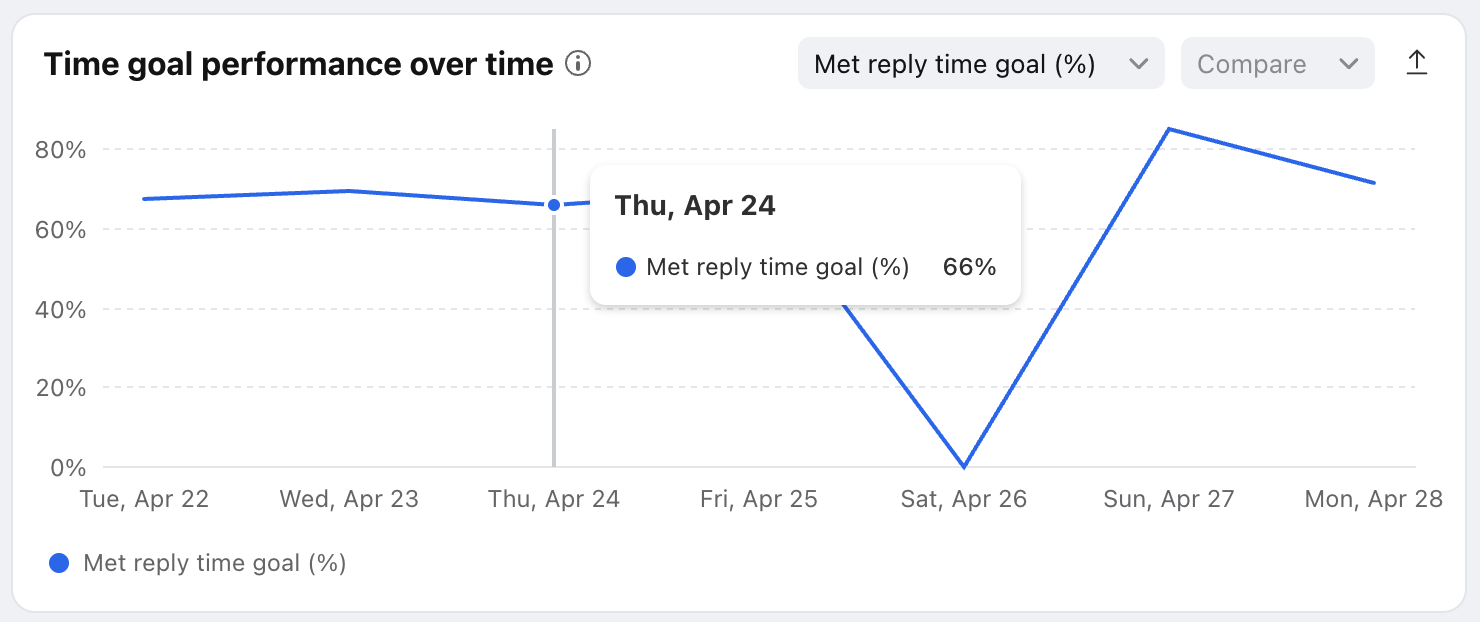
The Time goal performance over time line graph shows the changes in several key time goal metrics over time.
Click the dropdown menu to choose the metric you want to display, listed below.
Click the Compare dropdown at the top right of this section to display or hide values from the previous period.
Hover over points in the line graph to see specific metrics for each time increment.
Click on each metric to see the metric details; how it was calculated and which conversations were counted into the metric.
Metrics
Time goal by rule table
Features
The Time goal by rule table shows performance metrics for each time goal rule so that you get more granular statistics about your response times and overdue volume.
Use the dropdown at the top right of this table to switch between reply time goals and resolution time goals.
Click the dropdown at the top right of this table to select which metrics you want to display, listed below.
Customize how many rows you'd like to display on each page using the Rows per page on the bottom left.
Click to more pages using the arrows and numbers on the bottom right.
"Not applied by time goal rules" metric details:
There are two situations that count towards the "Not applied by time goal rules" metric:
(1) Teammates manually adding an overdue time goal tag to a conversation.
(2) Regular, non-time goal rules adding the overdue tag to a conversation. e.g. The rule wasn't explicitly set up as an time goal rule, but it uses "THEN: Add tag: Overdue" in its rule actions.
The Overdue time (avg) metric for "Not applied by time goal rules" is calculated using conversations where the following situation occurred:
Overdue tag added via any method
Overdue tag removed manually or removed by a regular, non-time goal rule
The Overdue time goals metric measures the number of times an overdue tag was added. So for "Not applied by time goal rules", if the Overdue time goals column is 0, this means that there were no times where a teammate manually applied an overdue tag or a non-time goal rule applied an overdue tag. In other words, every time an overdue tag is added during your reporting period, it is done so by an actual time goal rule.
If there is a value for Overdue time (avg) for "Not applied by time goal rules", this means that there were times where an overdue tag was removed manually or by a regular, non-time goal rule.
List of metrics
Time goal: the time limit defined in the time goal rule's conditions
Instructions
Set up a new report view by following this guide.
Pricing
This feature is available on the latest Professional plan or above. Some legacy plans may also allow access to this feature.


