
Use Front’s Support Report to share your team’s service metrics
Overview
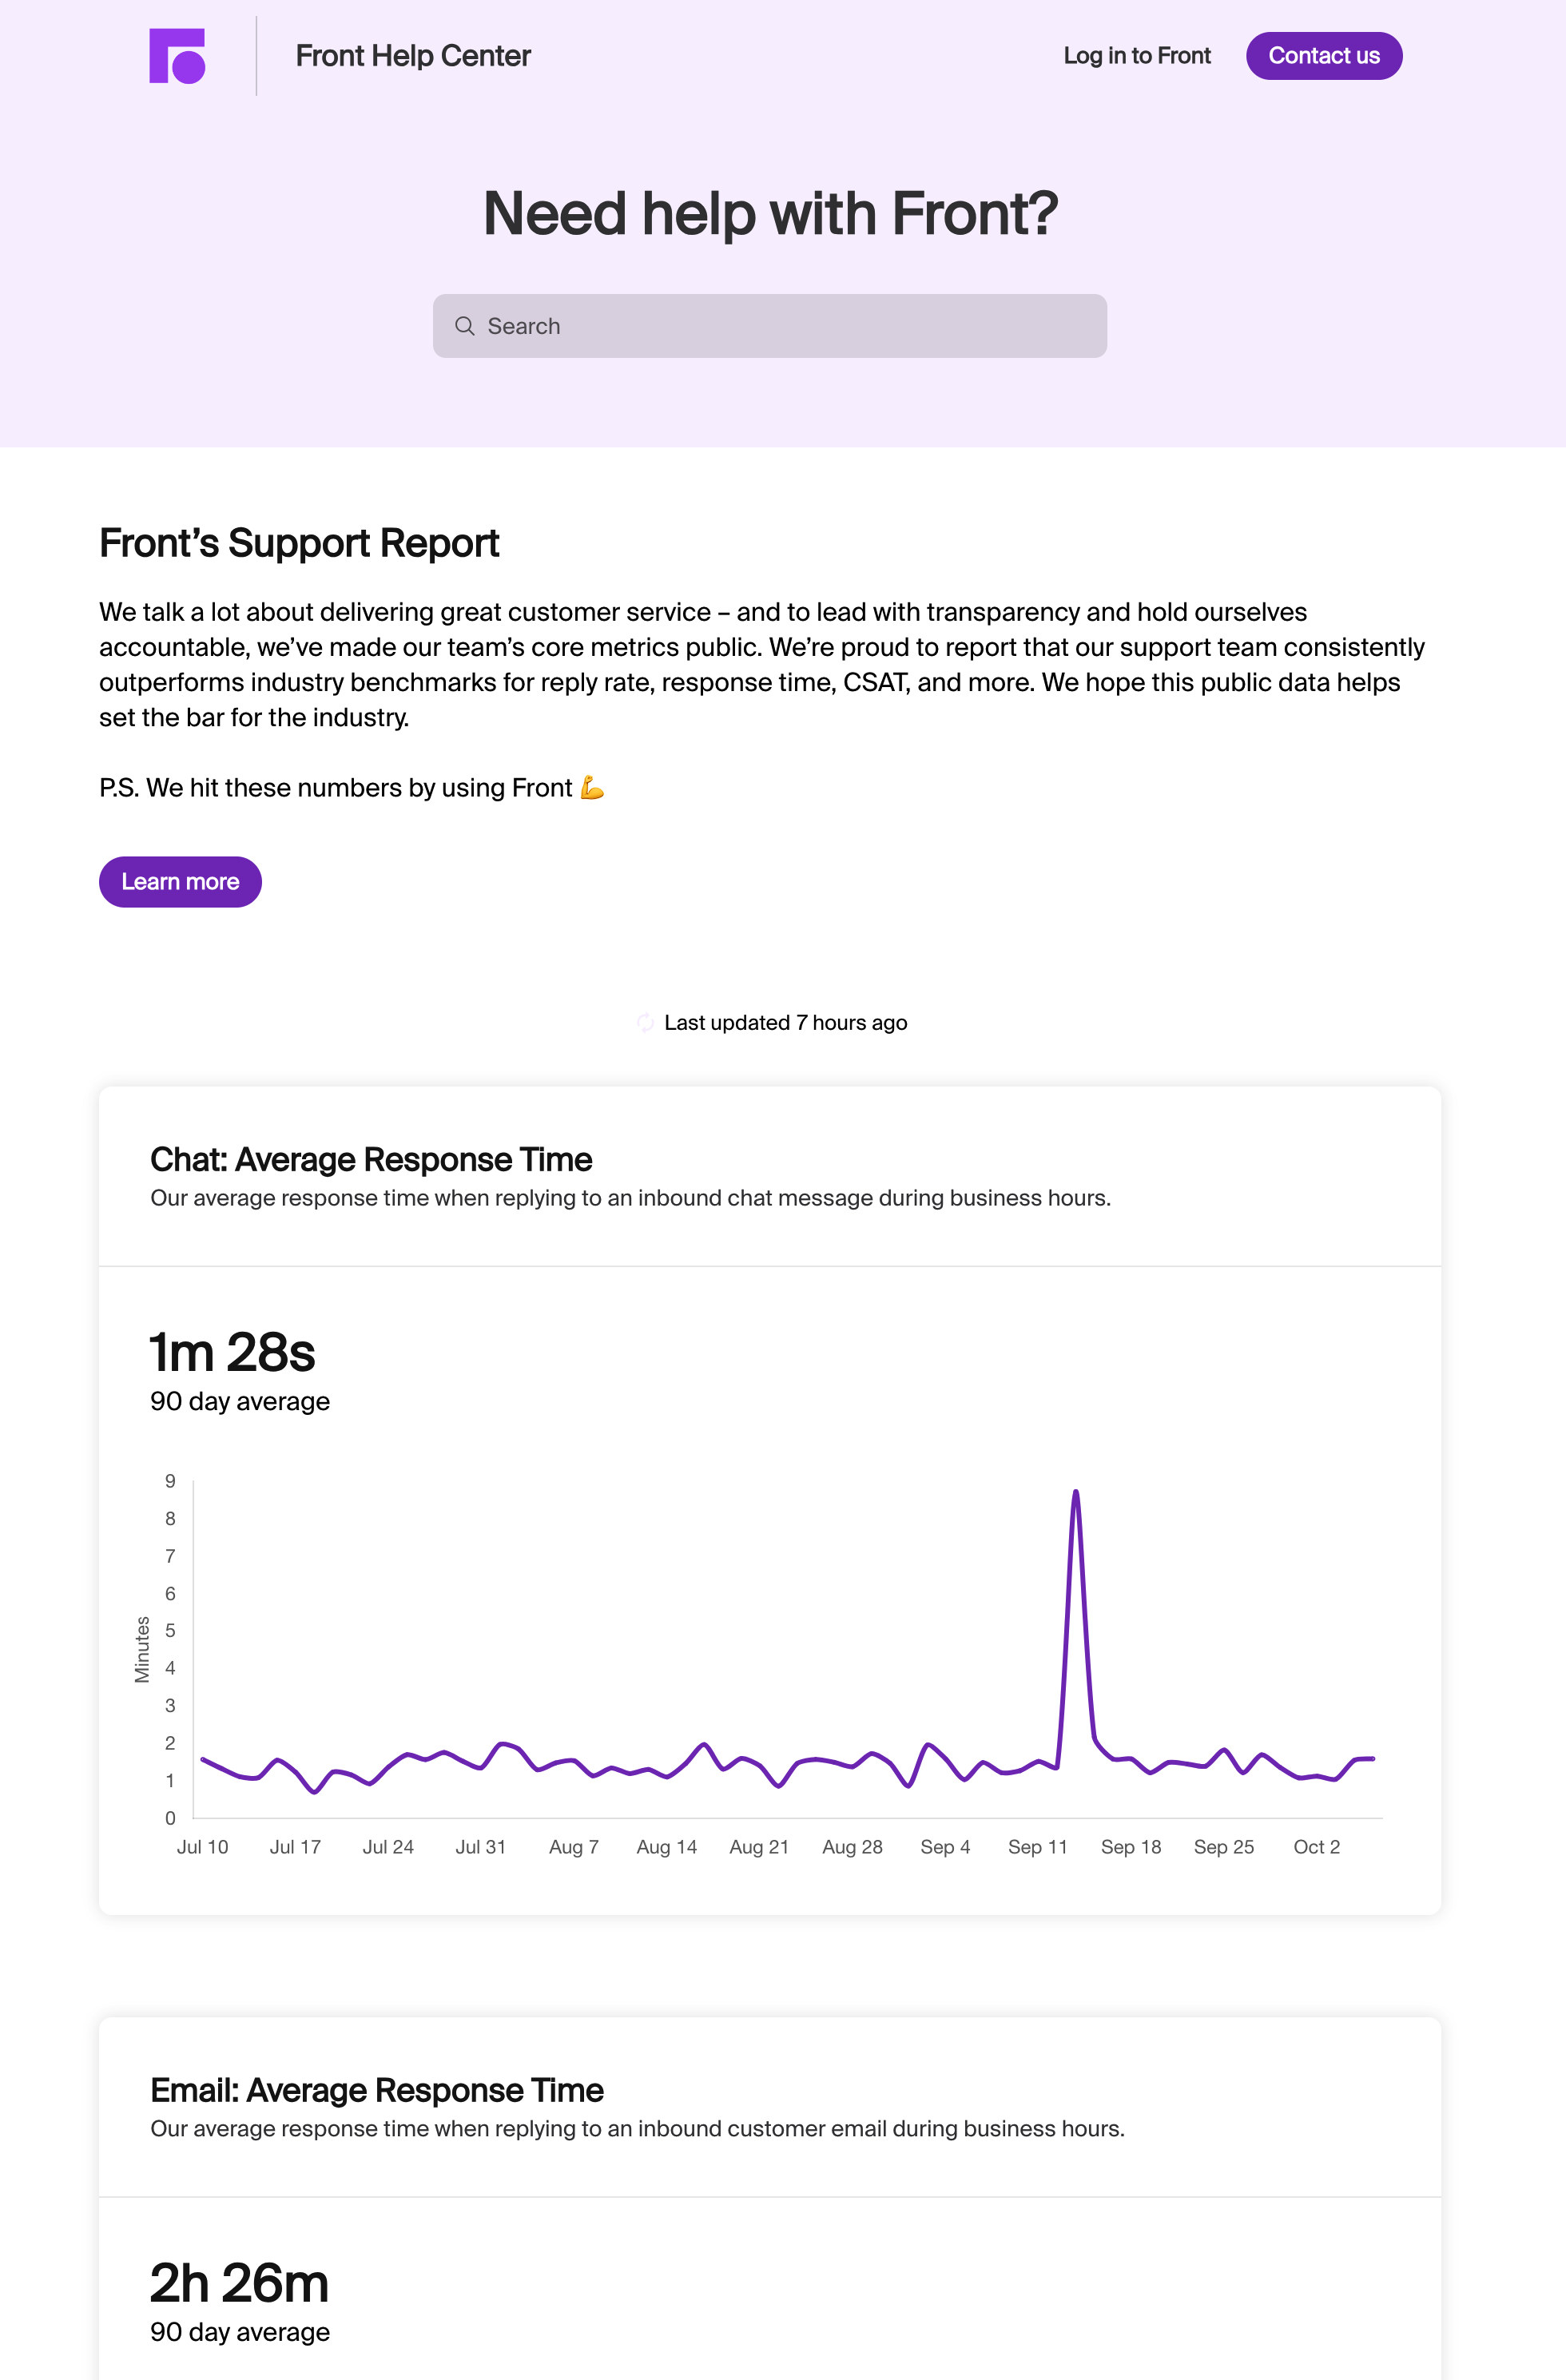
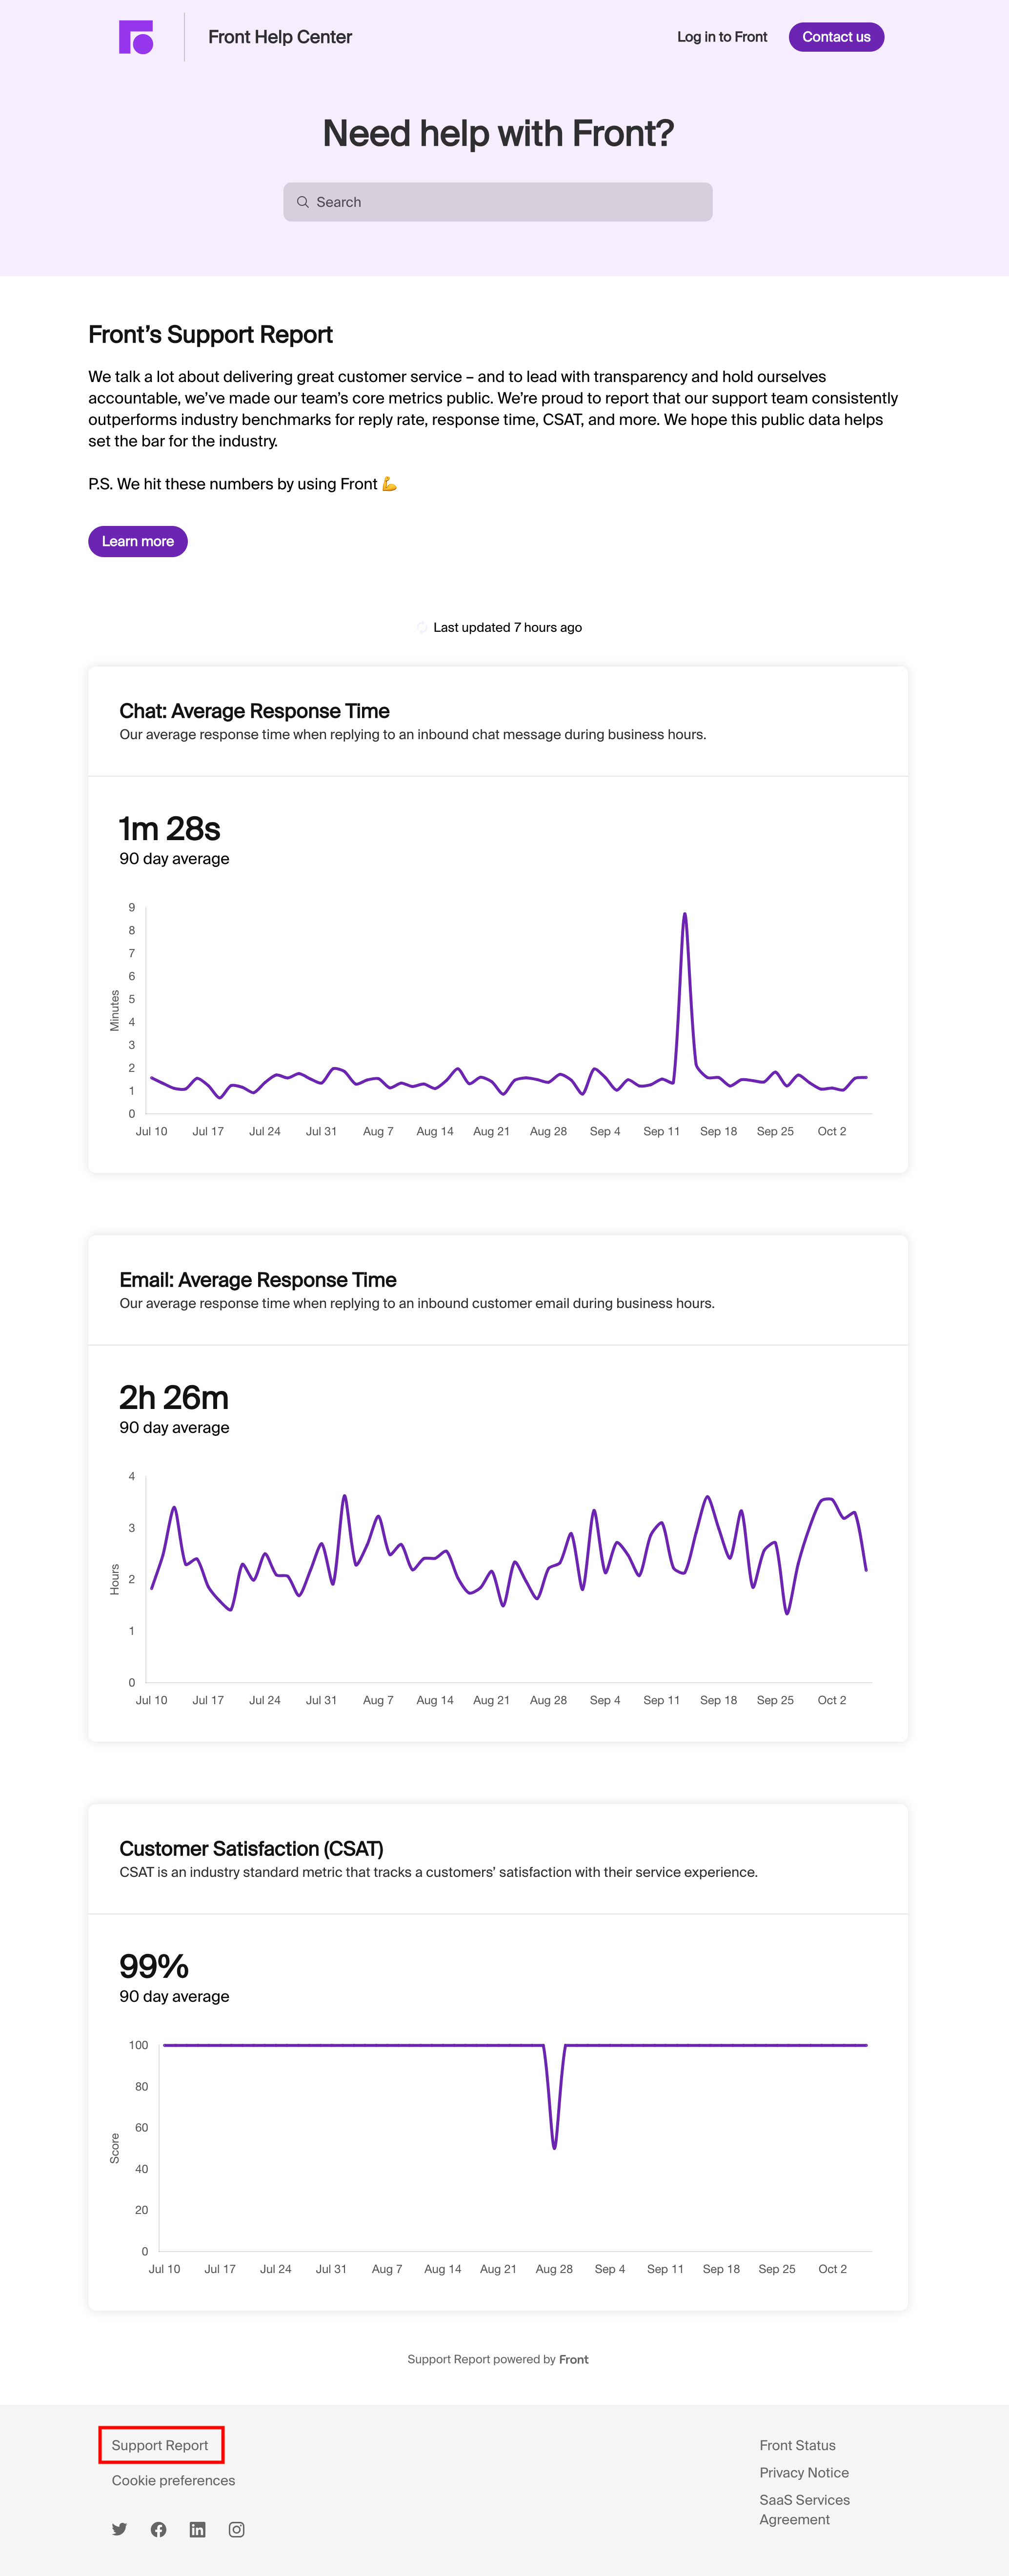
Use Front’s Support Report to make your support team’s real-time metrics public to your customers. Share your service metrics to foster a culture of transparency and continuous improvement that builds trust with customers and drives growth for your business.
For a real-life example, you can check out Front’s own Support Report here: https://help.front.com/en/support-report. Once you configure your custom report following the instructions below, you’ll be able to publish a similar page with no web development resources required.
Check out our Front Academy course here to learn more about leveraging value from the Support Report.
Prerequisites
To publish a Support Report, you must have:
Access to Front Analytics
A Front help center (public visibility and published)
Instructions
Part 1: Set up analytics views
Create analytics views to define the data you’d like to include in your Support Report.
Step 1
Open Front Analytics by clicking the Analytics icon in the top navigation bar.
If you have multiple workspaces, choose the desired workspace from the workspace dropdown.
Step 2
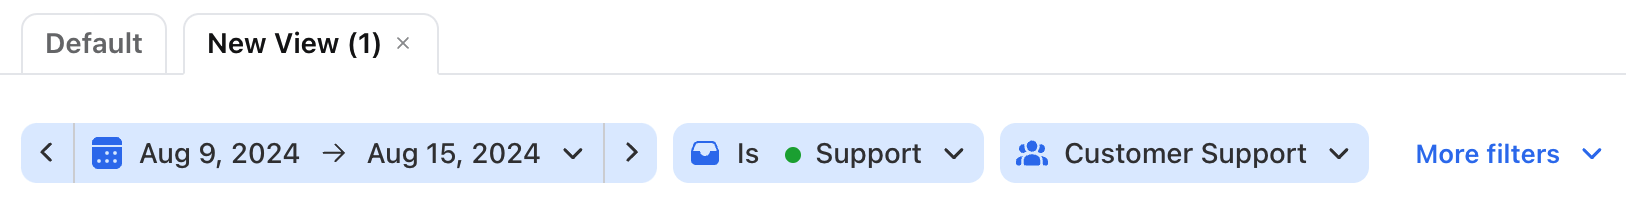
Click Add view, then use the filters to focus on the data you’d like to display in your report. See this article to review how to create an analytics view.
In this example, we’ll create a view that filters on members of the Support team and their email inbox:
Inbox filter: Select email inbox(es)
Teammates filter: Select Customer Support teammate group
Step 3
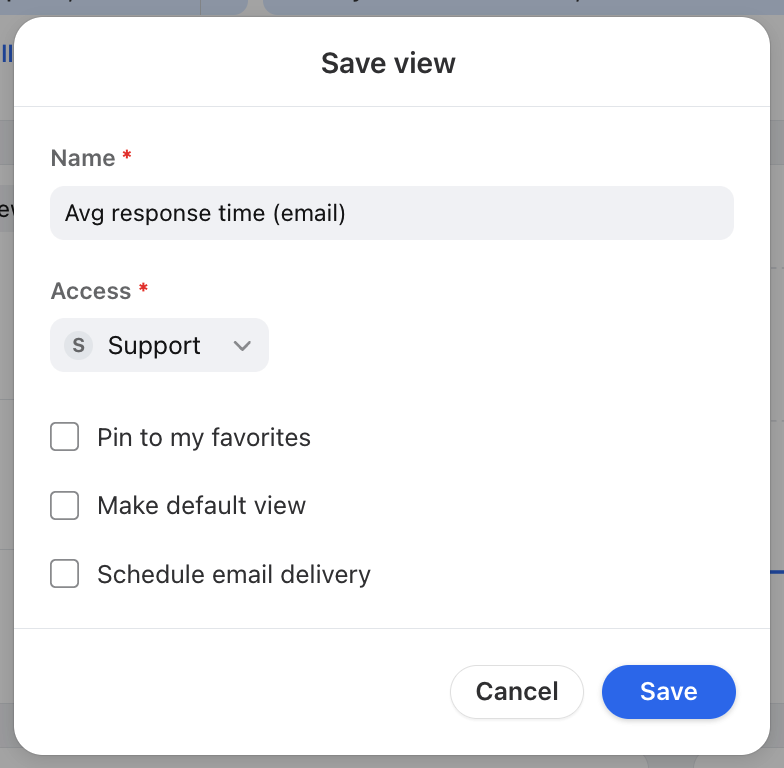
Click Save as new view and fill out the fields in the pop-up to save the view.
Step 4 (optional)
If needed, continue creating views for any additional combinations of inboxes, teammates, or other filters.
Part 2: Set up report metrics
Configure custom headers and descriptions for the metrics in your report.
Step 5
In Analytics, select Support Report in the left navigation panel.
Step 6
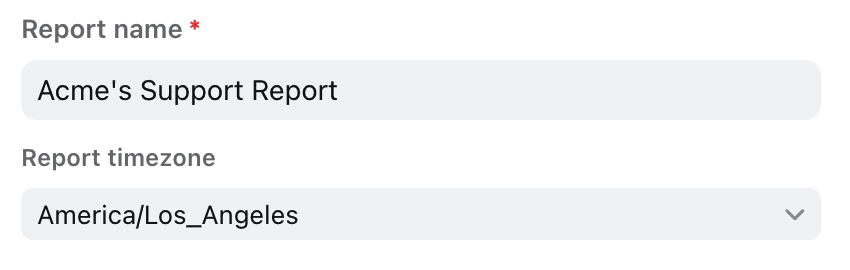
Enter an internal name for your report, then select the time zone the report will use.
Step 7
In the Metrics section, click Add metric. In the panel on the right, fill in the following fields:
Title: External title for your metric
Description (optional): External information you want to provide about your metric. e.g. Define how you measure your metric, explain your process, etc.
Metric type: Select from Average Response Time, First Response Time, or CSAT
View: Select the analytics view used to generate data for the metric
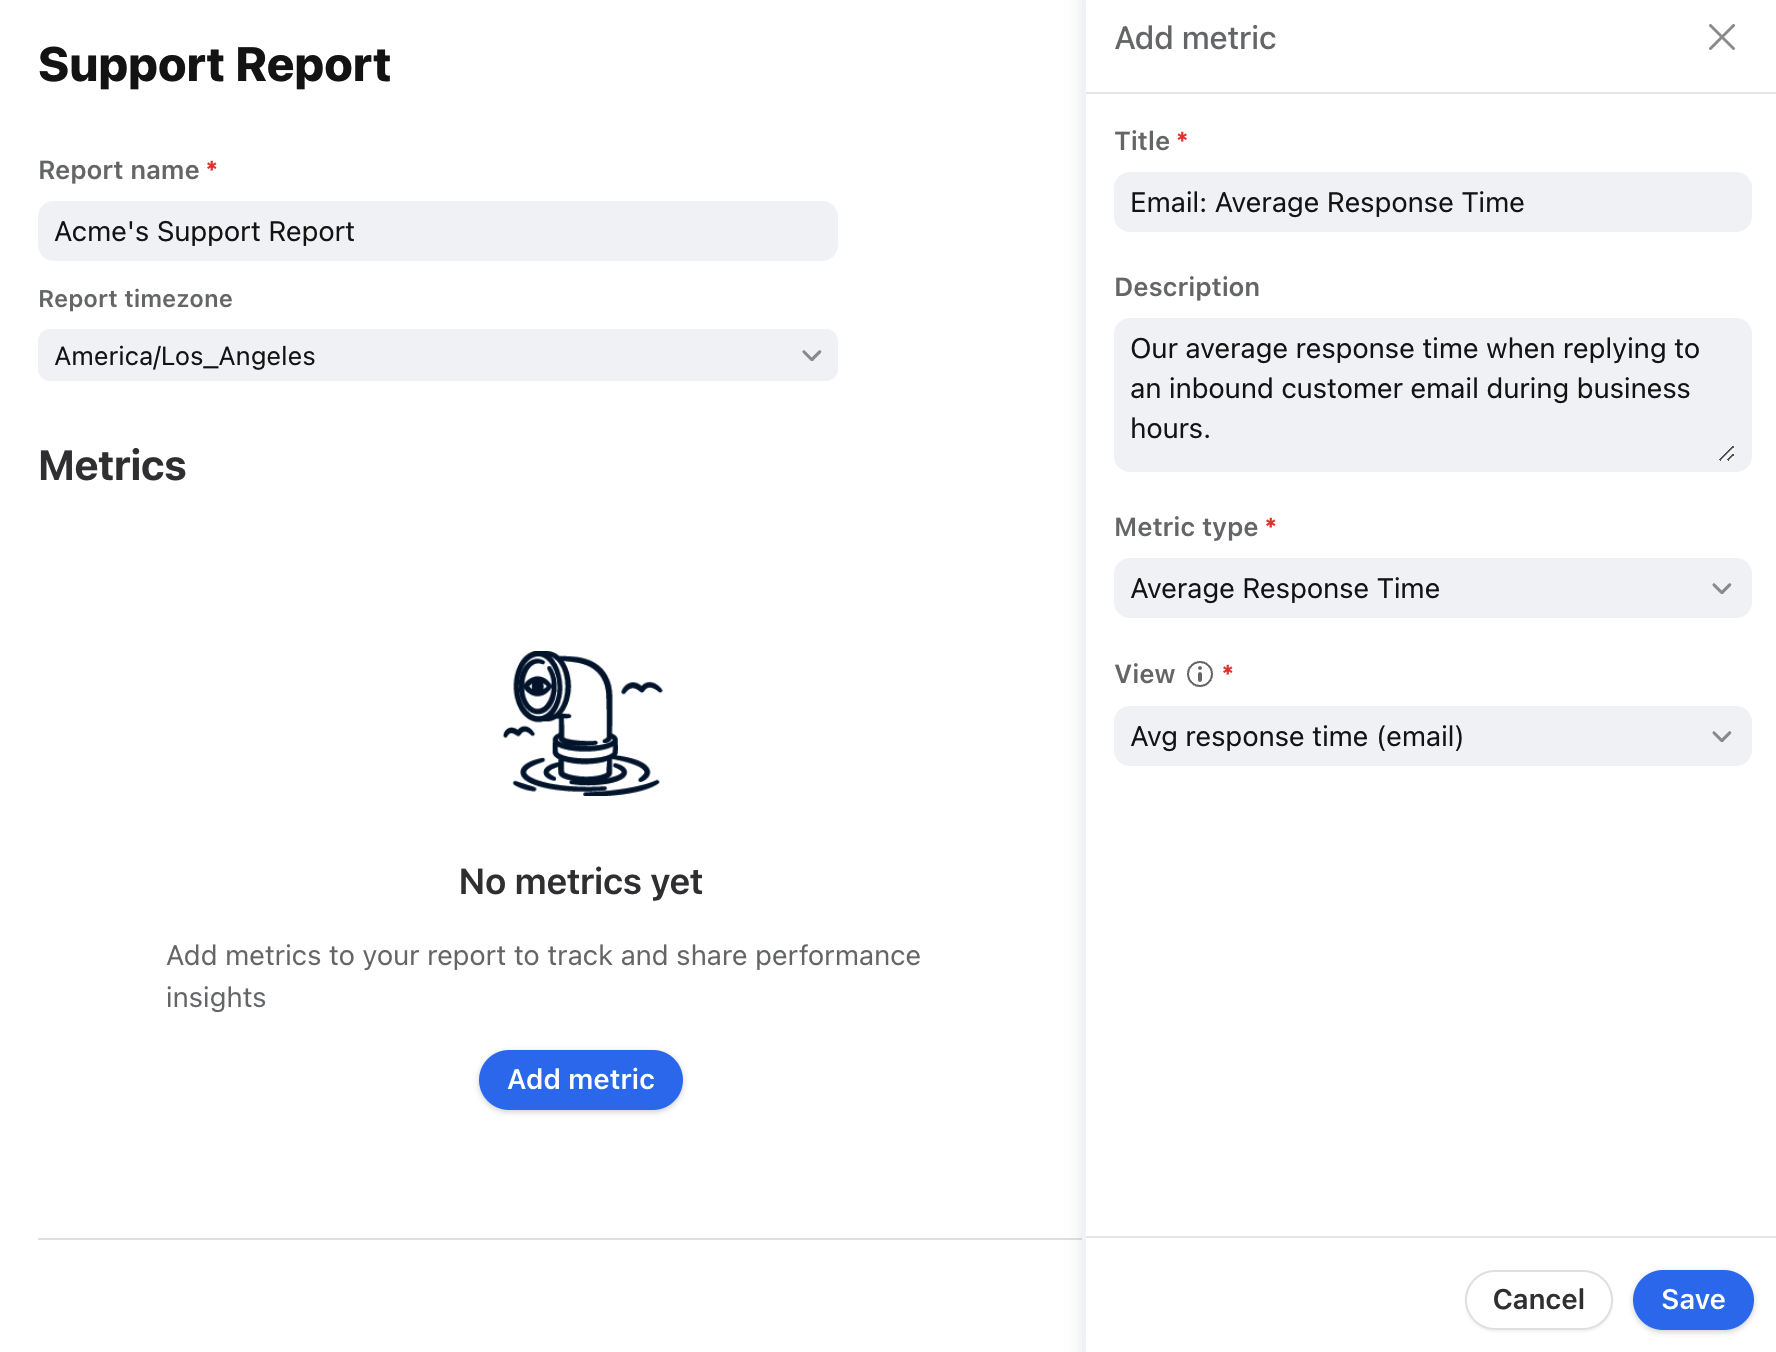
Step 8
Click Save to add the metric to your report.
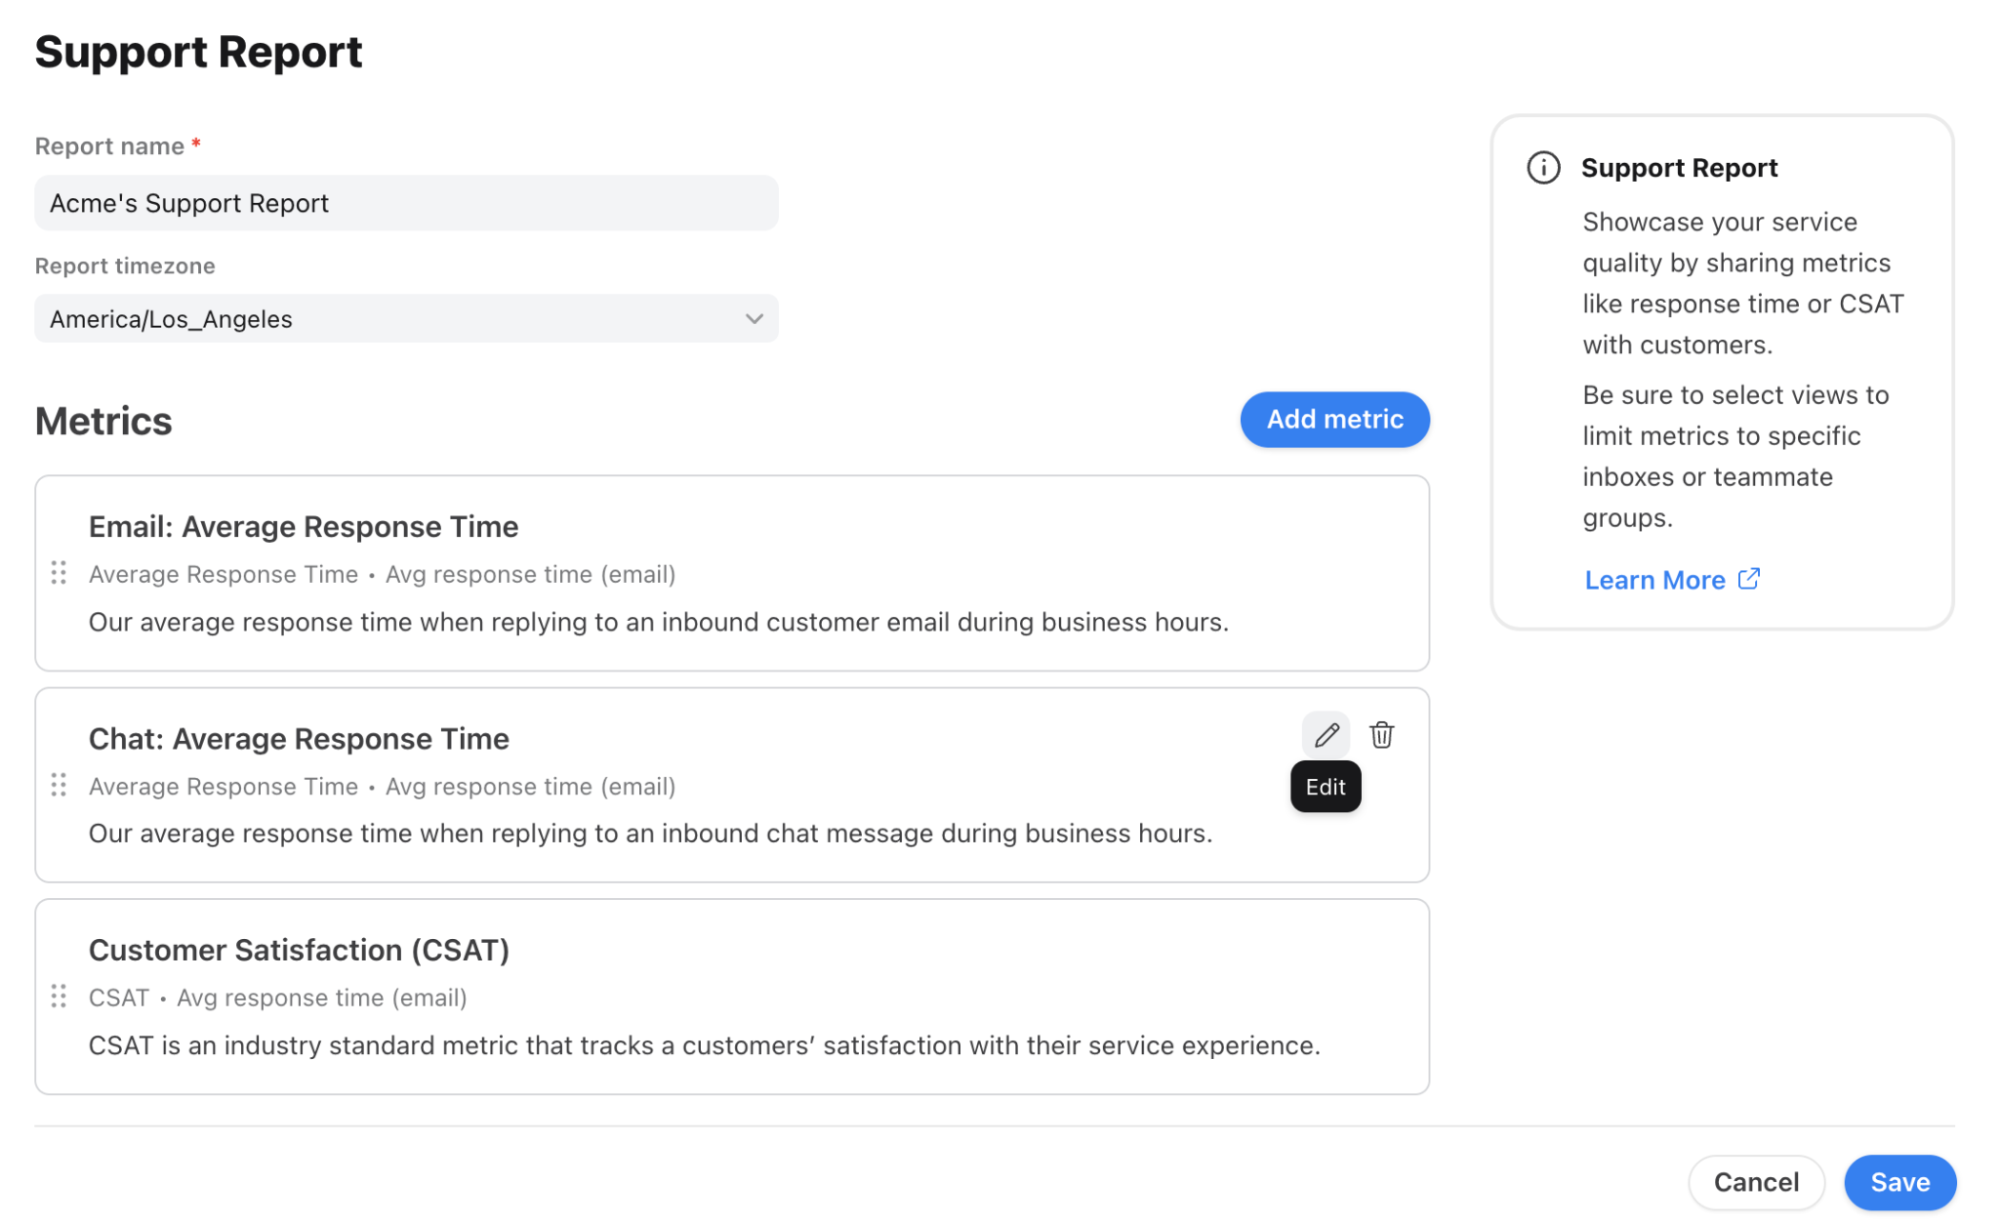
Step 9
Continue adding metrics to your report as needed, then click Save to save the entire report.
You come back to this page any time to reorder, edit, or delete your metrics.
Part 3: Publish report
Use your help center to publish your Support Report metrics and make them publicly available.
Step 10
Click View in help center in the banner at the top to navigate to your help center.
You can also click the help center icon in the top navigation bar, select your help center, click the Settings tab under Site management.
Step 11
In the Configuration tab, navigate to the Features section and toggle on the Support report feature. Click Save.
Step 12
Under the new Customer portal section in the sidebar, select Settings.
Step 13
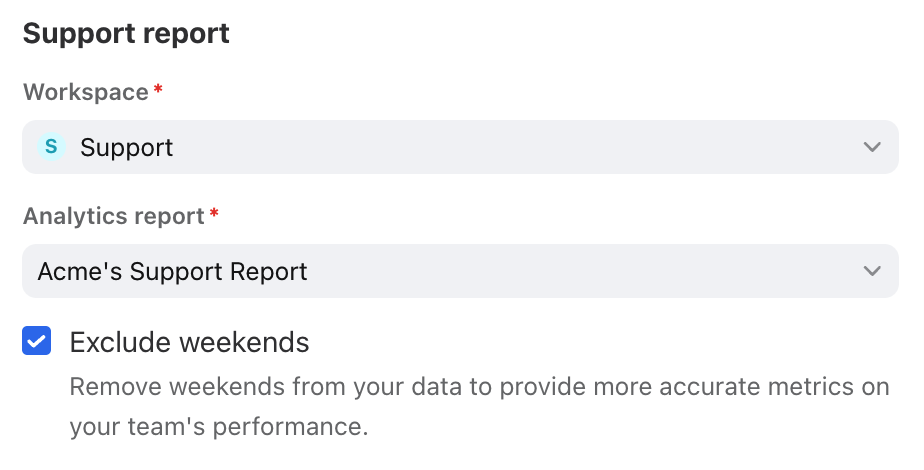
In the Support report section, select the workspace and the report you created in Analytics. You can also exclude weekends from your report to smooth out gaps in data if your team is not working.
Step 14
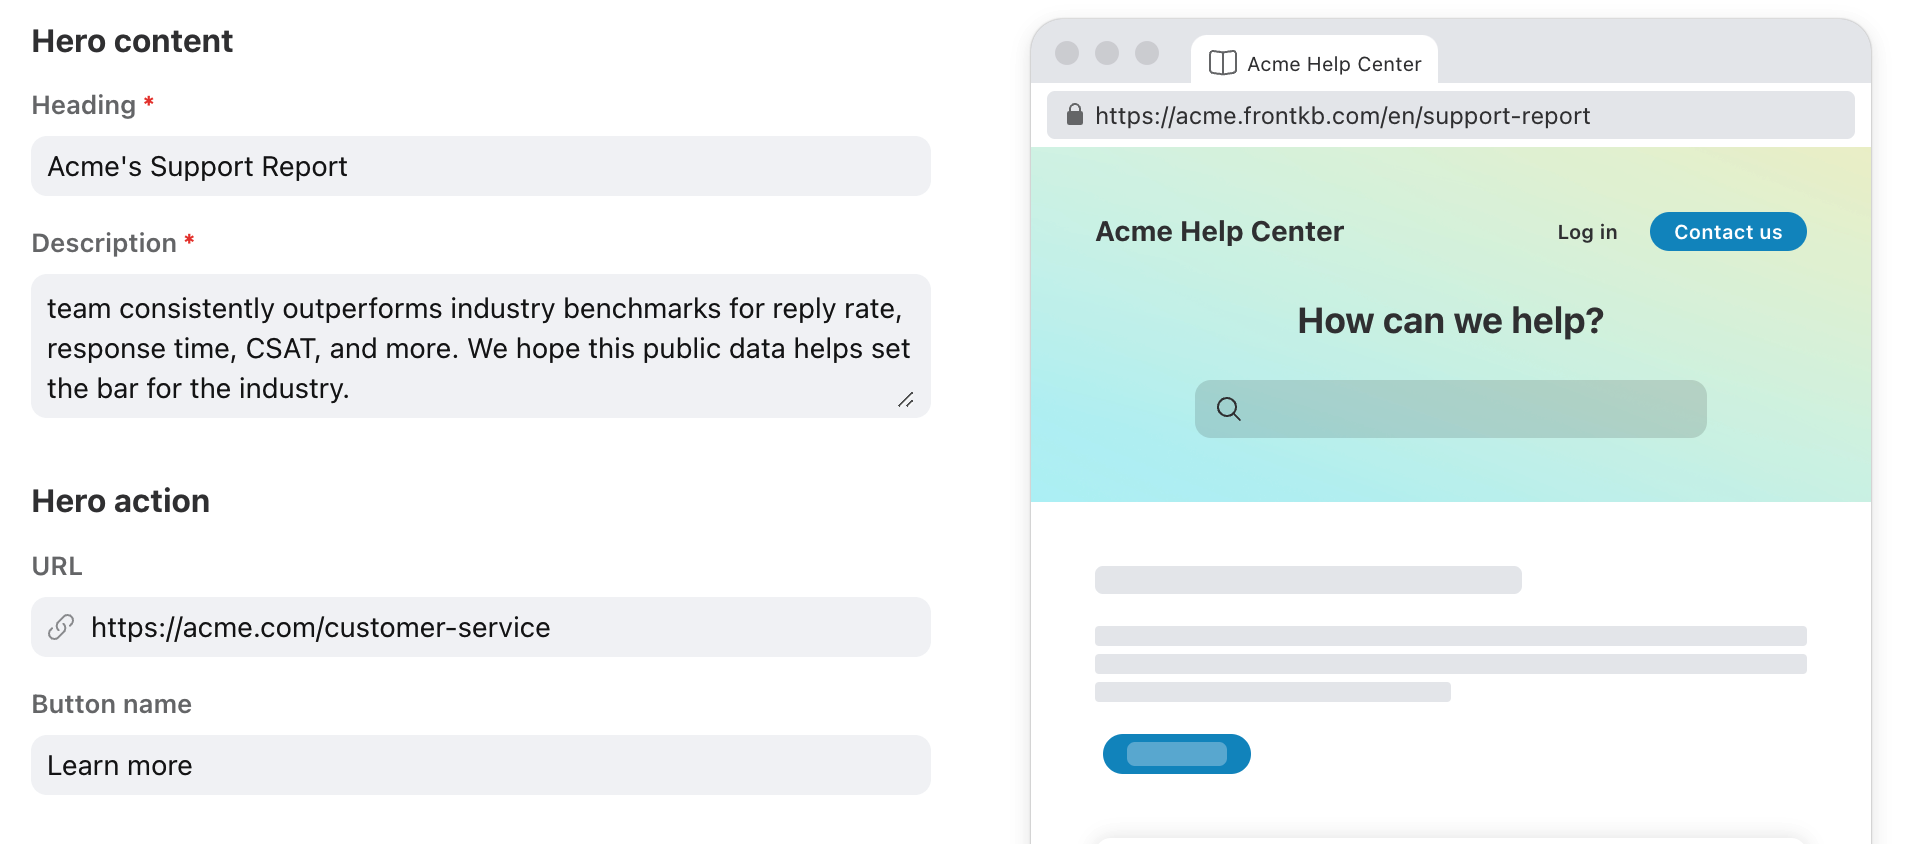
In the Hero content section, add a public-facing title and description for your report. Optionally, use the Hero action section to add a URL and direct your customers to a supporting resource.
Step 15
Click Save to publish the Support Report to your help center.
Viewing your report
Once your Support Report is published, customers can find it in the footer of your help center.
FAQ
How many Support Reports can I set up?
You can set up one Support Report per workspace.
Can I use one Support Report with multiple help centers?
Yes. You can select the same Support Report across multiple Front help centers.
Can I preview my Support Report before publishing?
Yes. Use the Preview site button in your Support Report settings to review your content.
Can I embed my Support Report on an external page?
Yes. You can embed the charts from the Support Report on a page you host using the Knowledge Base API. Use the route https://[yourkbdomain].com/en/support-report.slim. Your Front help center and Support Report both need to be published.
Can I use individual analytics views?
No. Support Report metrics only support shared views.
Pricing
This feature is available on the latest Professional plan or above. Some legacy plans may also allow access to this feature.