[Customer Beta] Exploring Front’s new Analytics experience
⚠️ This feature is in beta: Enterprise plan only. This article may require final changes before the feature is available to all customers.
Overview
Front Analytics has been refreshed with a new, simplified navigation system to make it easier to create, customize, and share reports. For users on the Enterprise plan, you have access to unlimited, fully customizable custom reports — any metric, any visualization, customizable layout, with no cap on how many reports you create.
What’s new
For all plans
Redesigned navigation: Pin the reports you use the most, and find everything else in the All reports list.
New report actions: Create multiple reports, in addition to pinning, sharing, deleting, and duplicating them.
Report templates: Prebuilt reports are now used as templates, with an improved UI throughout.
No more analytics views: Analytics views are now simply “reports”. Each report you create is a saved set of selected metrics, visualizations and filters, with a clear name.
For the Enterprise plan
In addition to the improvements listed above, Enterprise plan users can also:
Add/remove charts in template-based reports
Build unlimited custom reports from scratch, mixing any metric and visualization type
Customize report layouts by resizing charts, and rearranging charts via drag and drop
Creating reports
Step 1
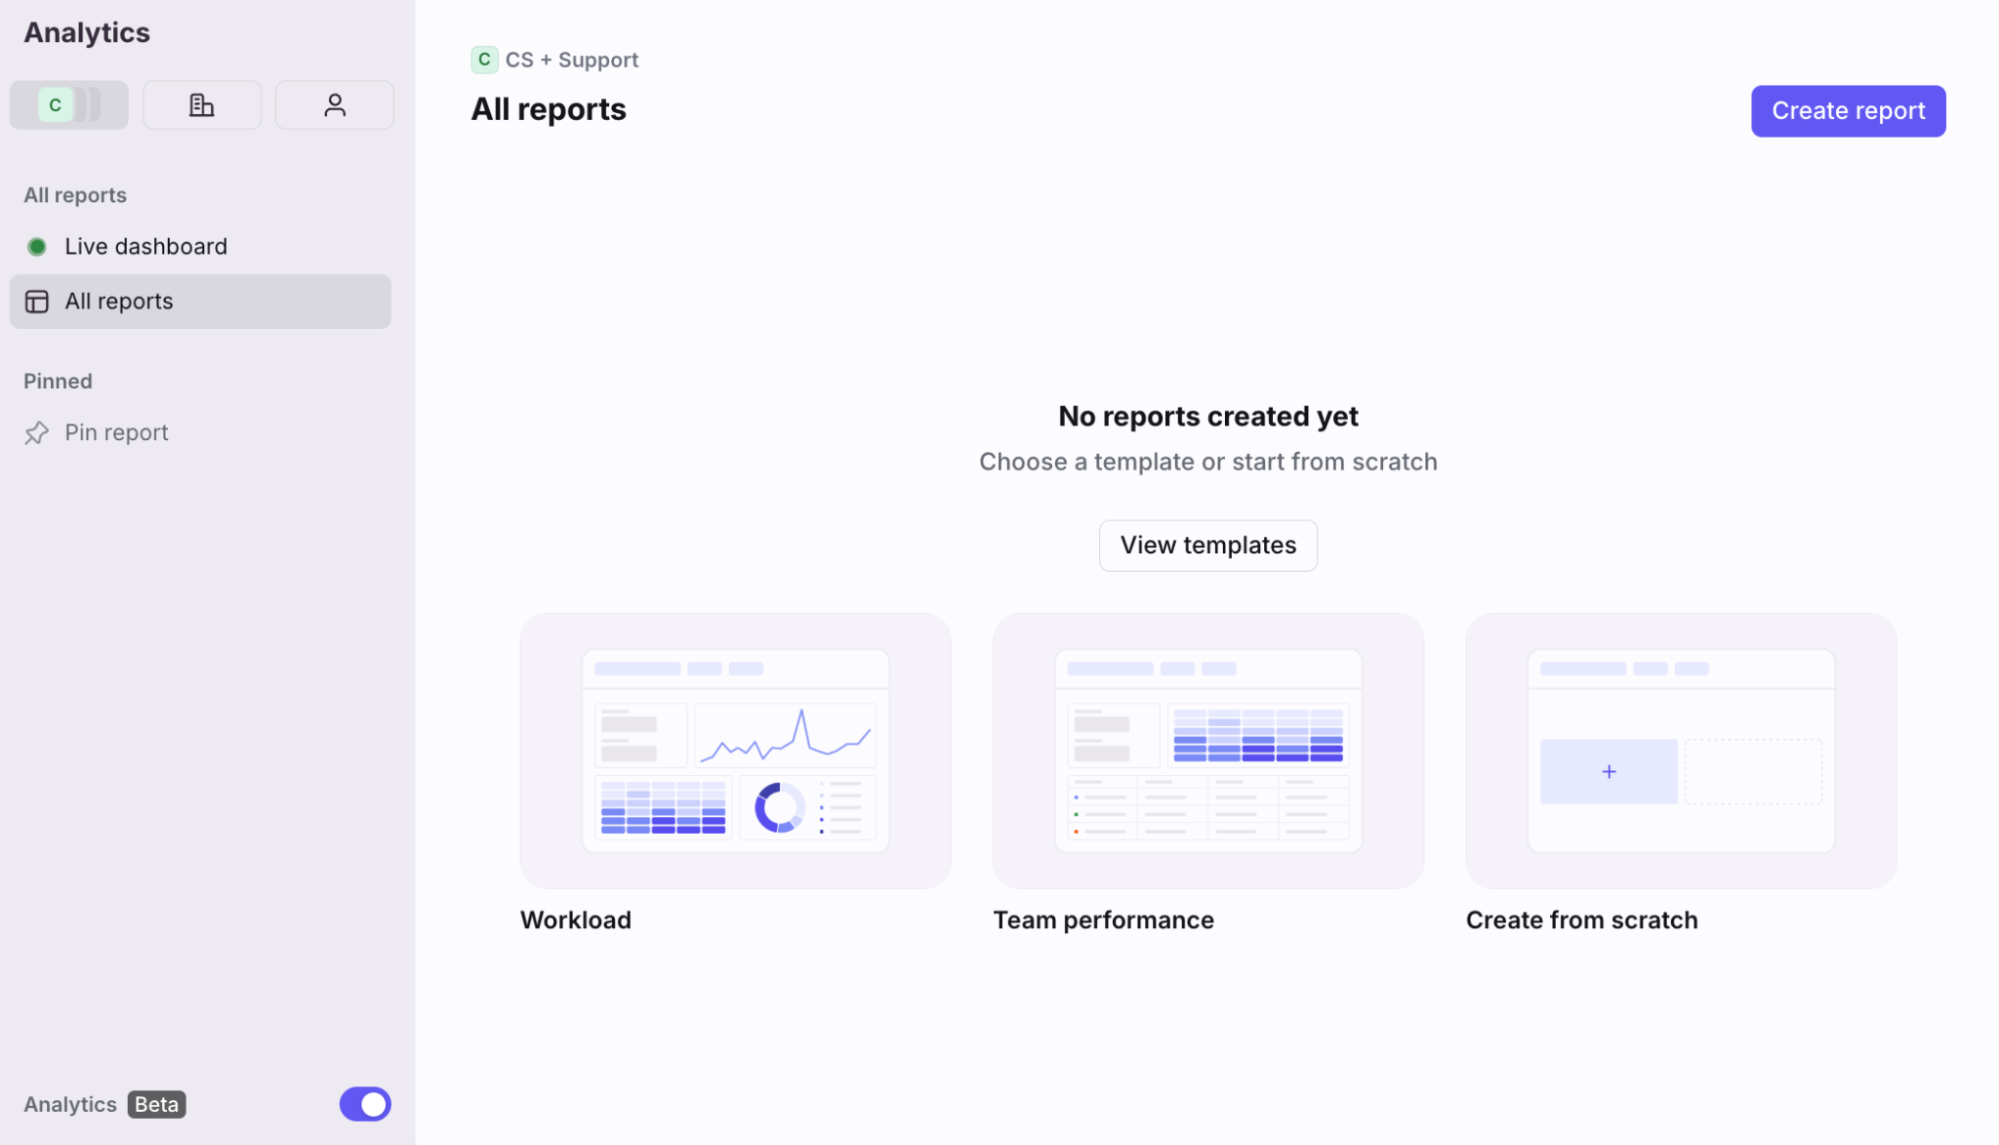
In the navigation menu, select Analytics, then select workspace, company, or personal analytics, depending on the space you’re working with. Click Create report.
In this example, we’ll create a report in the “CS + Support” workspace.
Step 2
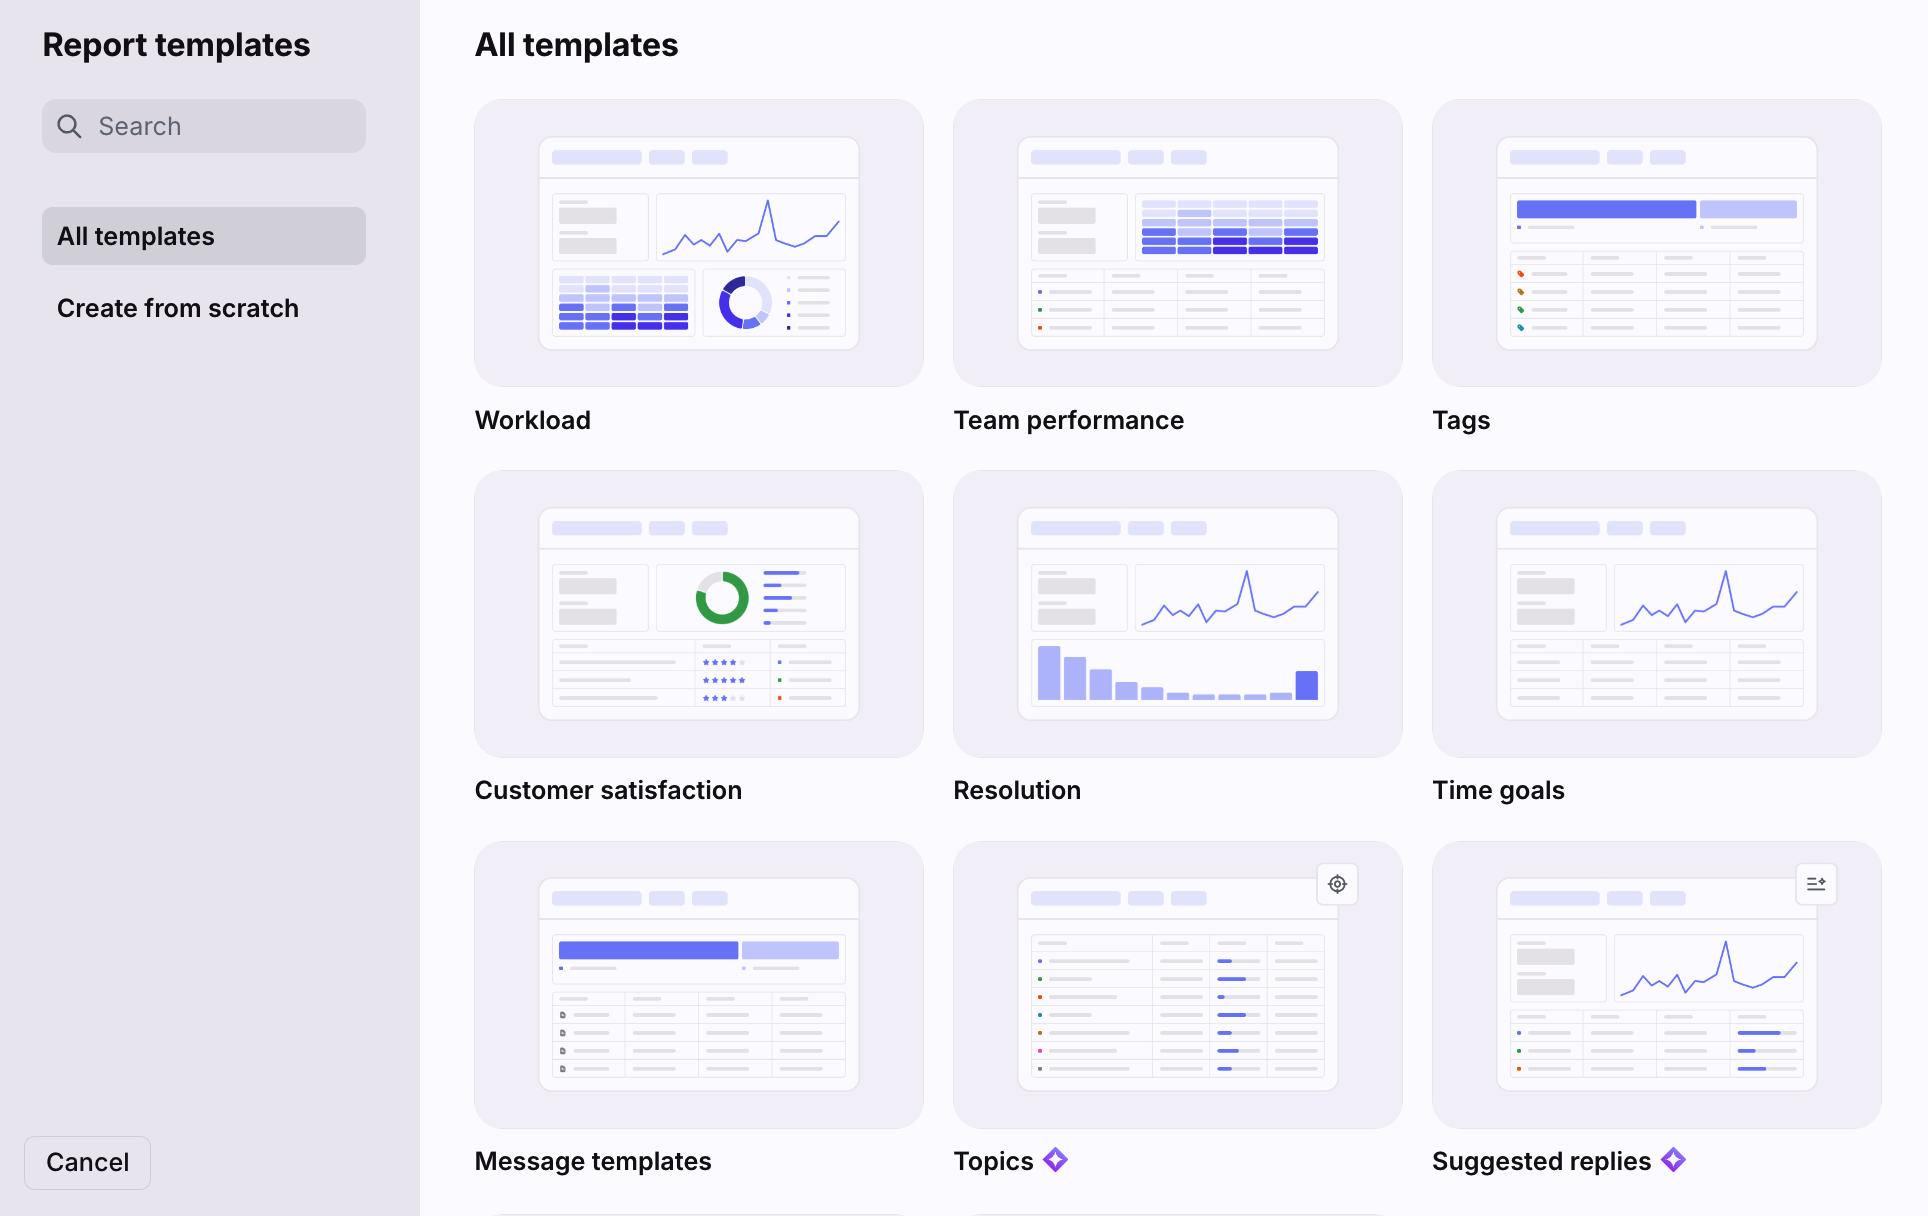
Select a report template as a starting point (all plans), or select Create report to build one from scratch (Enterprise plan only).
In this example, we’ll select the Workload report.
Step 3
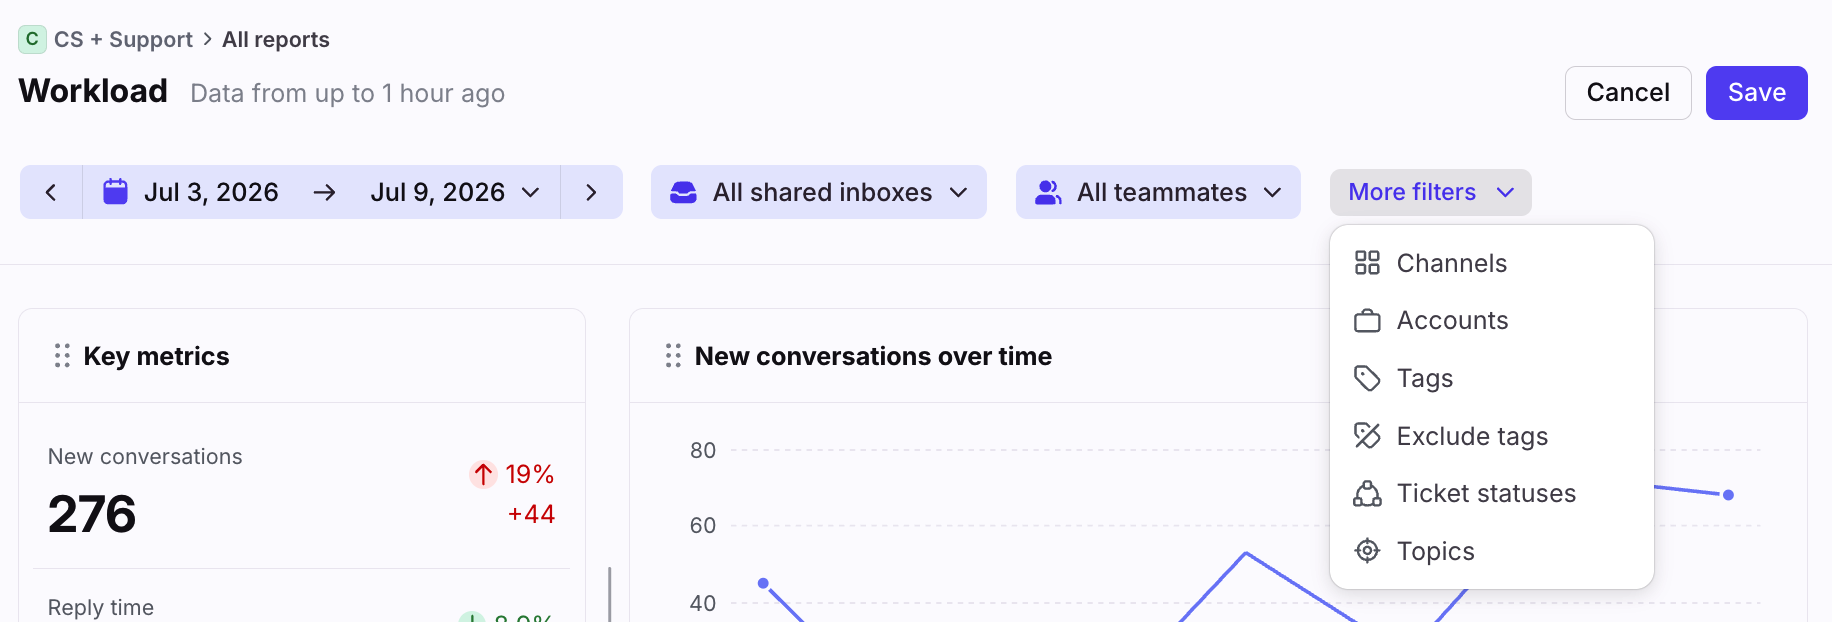
Use the filters at the top to focus on specific inboxes, teammates, and more.
Step 4
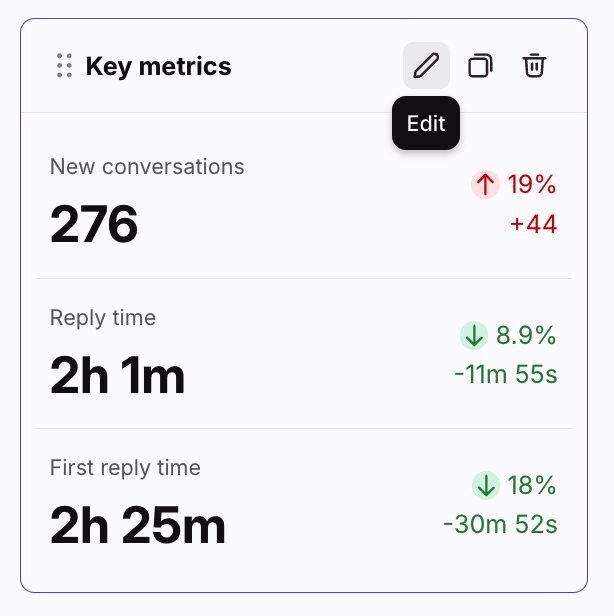
Hover over any chart and click the pencil icon to select the metrics you want to display.
Step 5
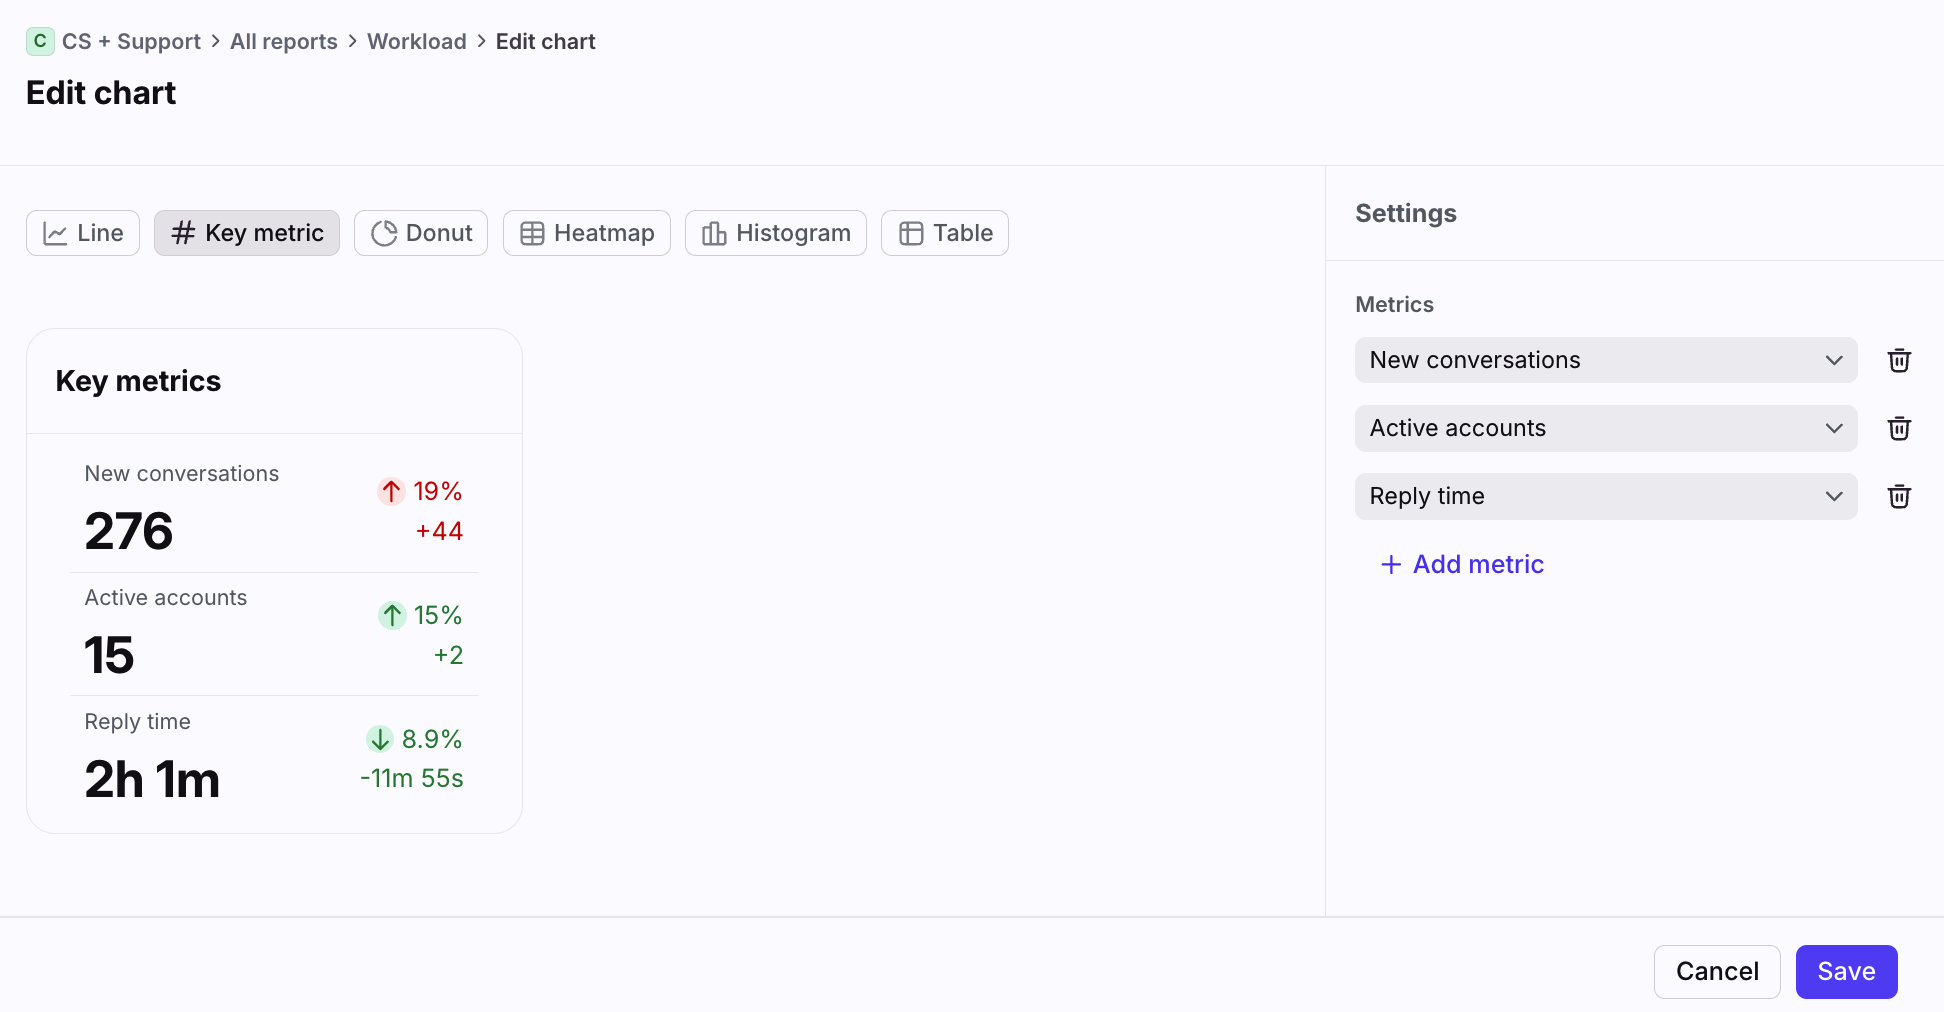
Use the dropdown menus to select your metrics, then click Save.
Enterprise plan only: You can also add/remove the number of metrics, or change the chart type.
Step 6
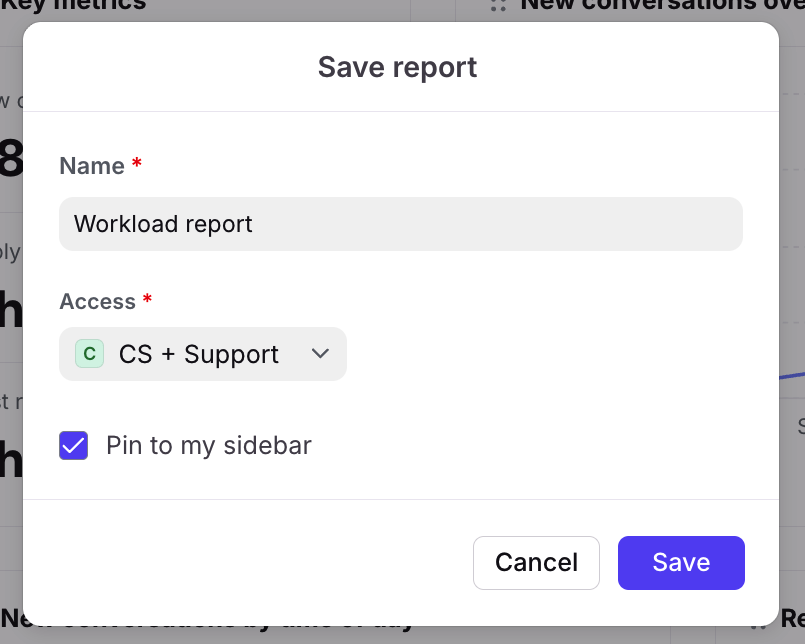
Once you’re done customizing the report, click Save at the top. In the pop-up, fill in the following fields:
Name: Name of the report
Access: Select who can access the report
Workspace: Everyone in the workspace with analytics permissions can access the report
Private: Only you can access the report
Pin to my sidebar: Check the box to add the report to the Pinned section of your sidebar
Click Save to finish creating your report.
Step 7
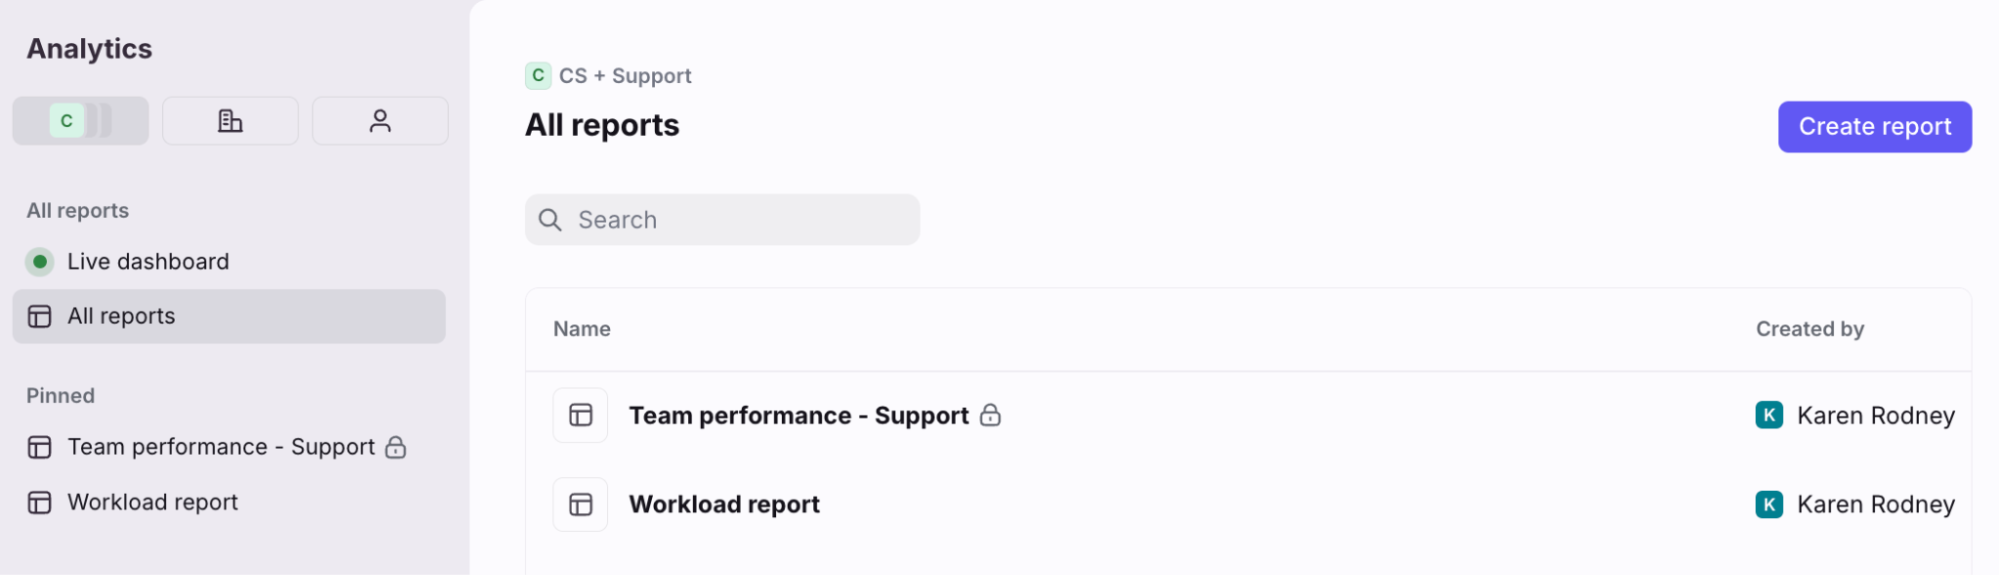
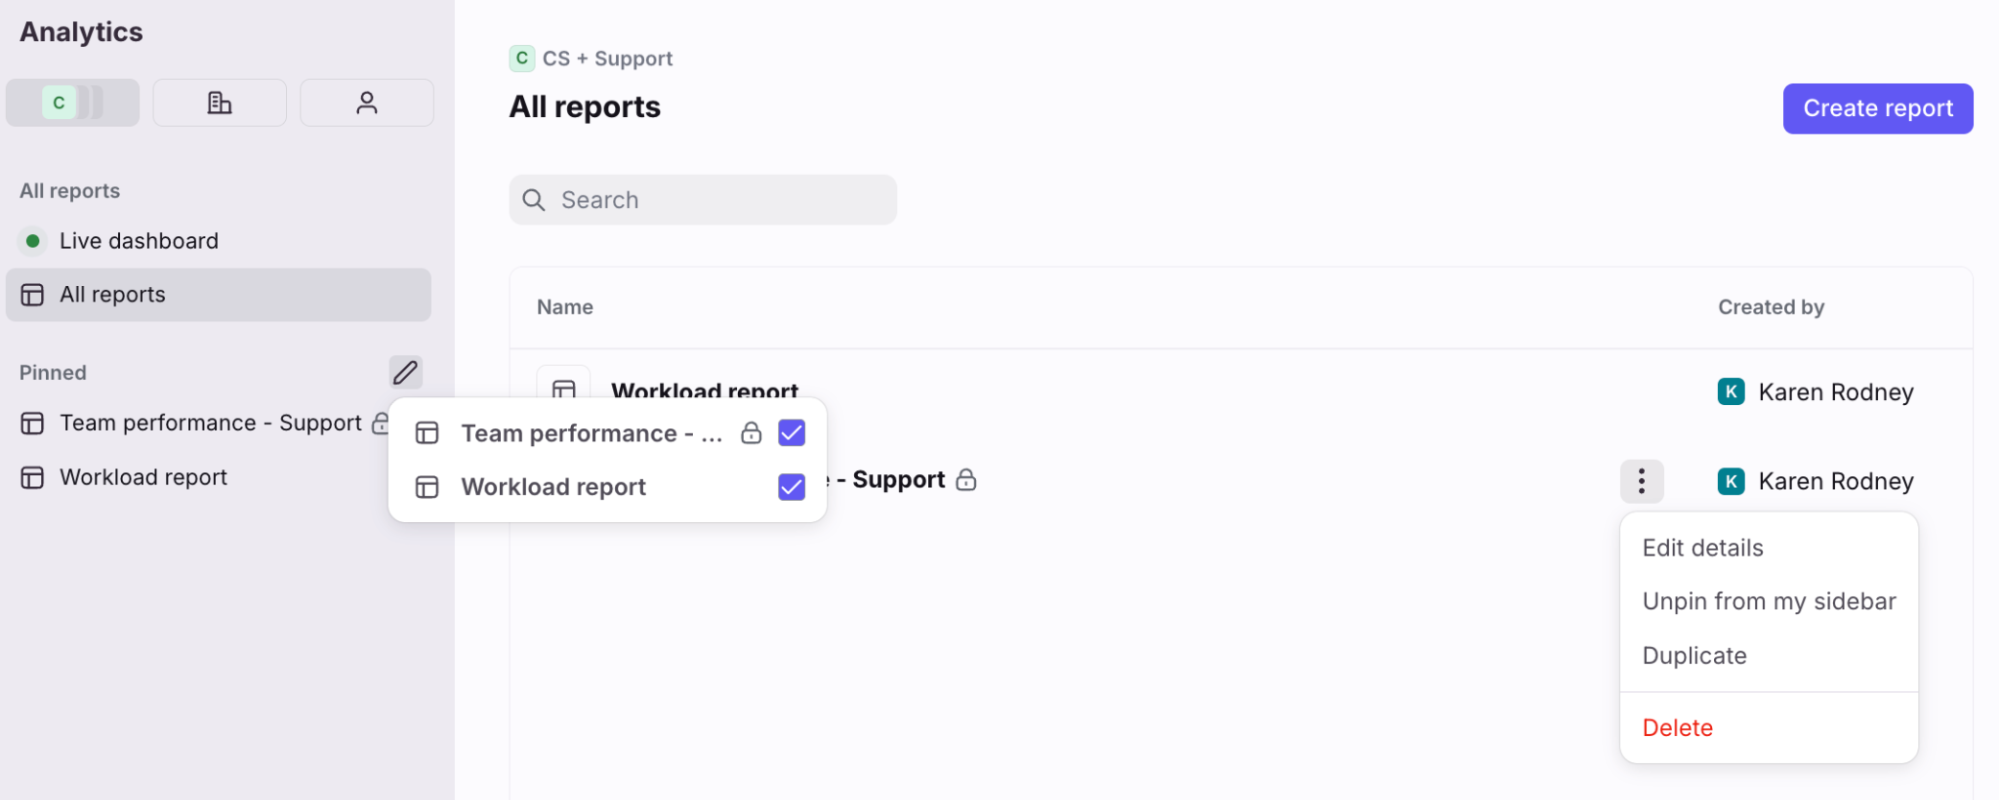
You’ll see the report listed in All reports, and in your sidebar if you chose to pin it. Private reports are indicated with a lock icon.
Additional customization
Enterprise plan only: You can further customize your reports using the options below.
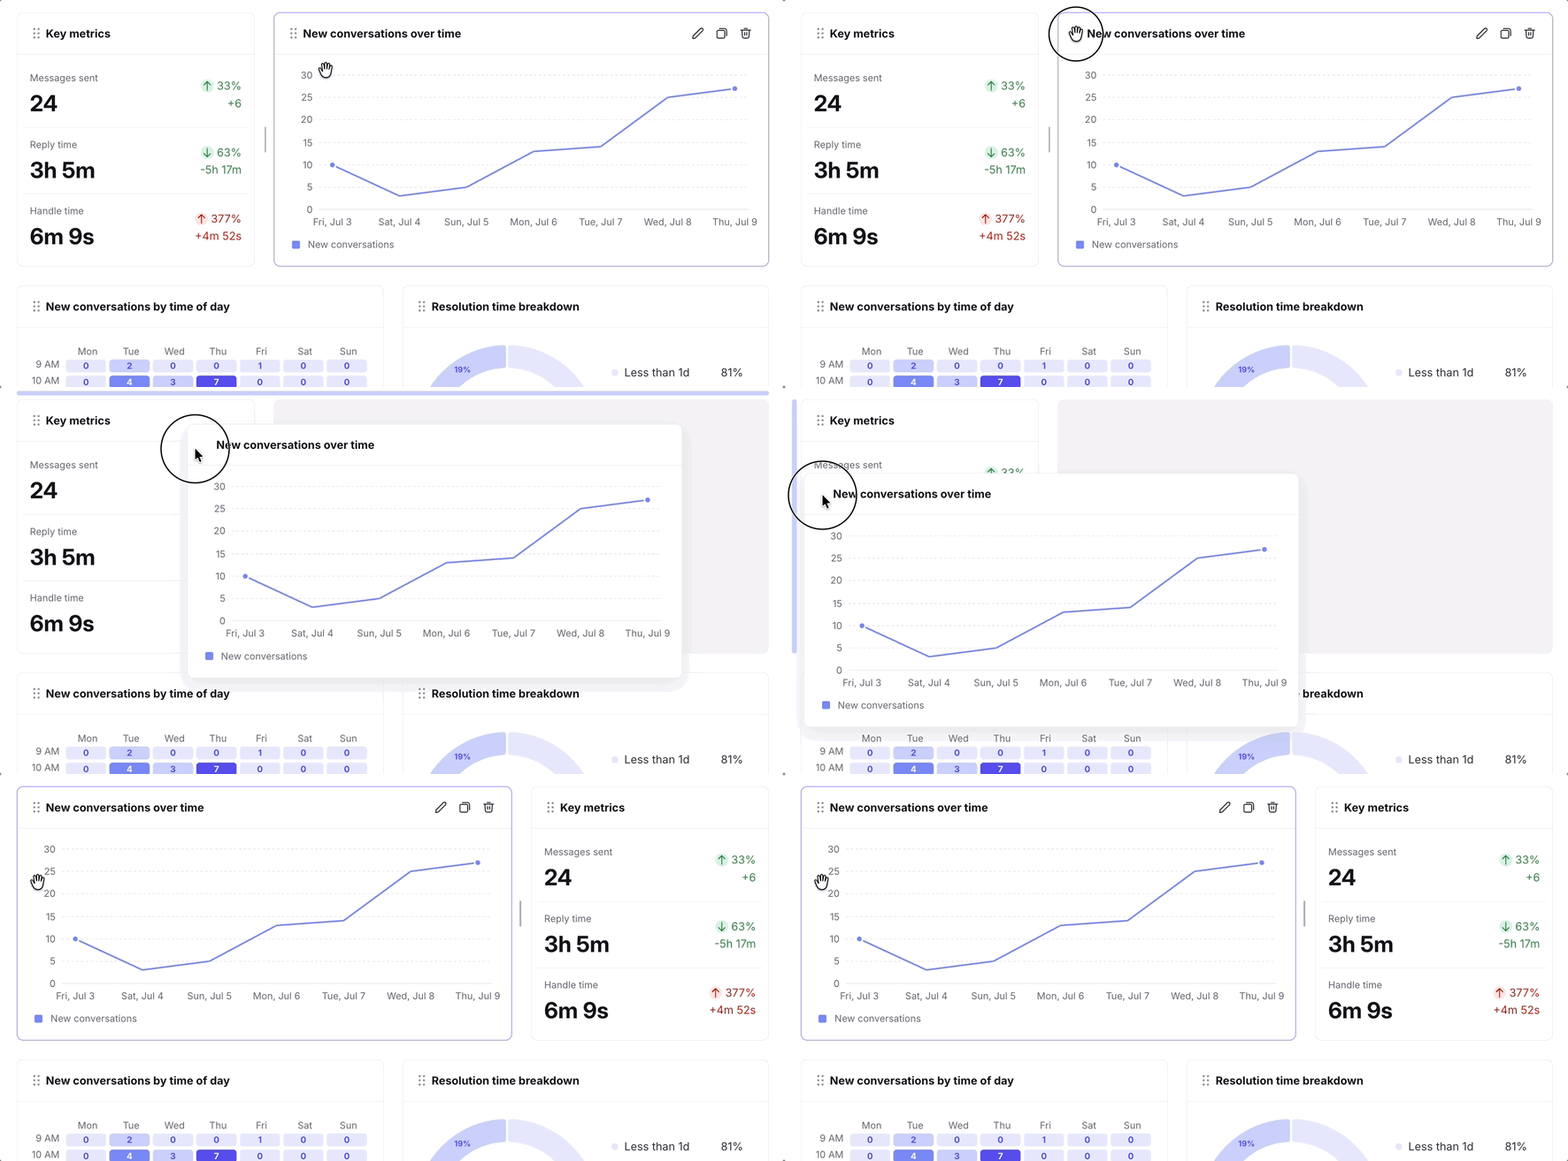
Rearrange charts
Customize your report layout by dragging and dropping charts into your preferred arrangement.
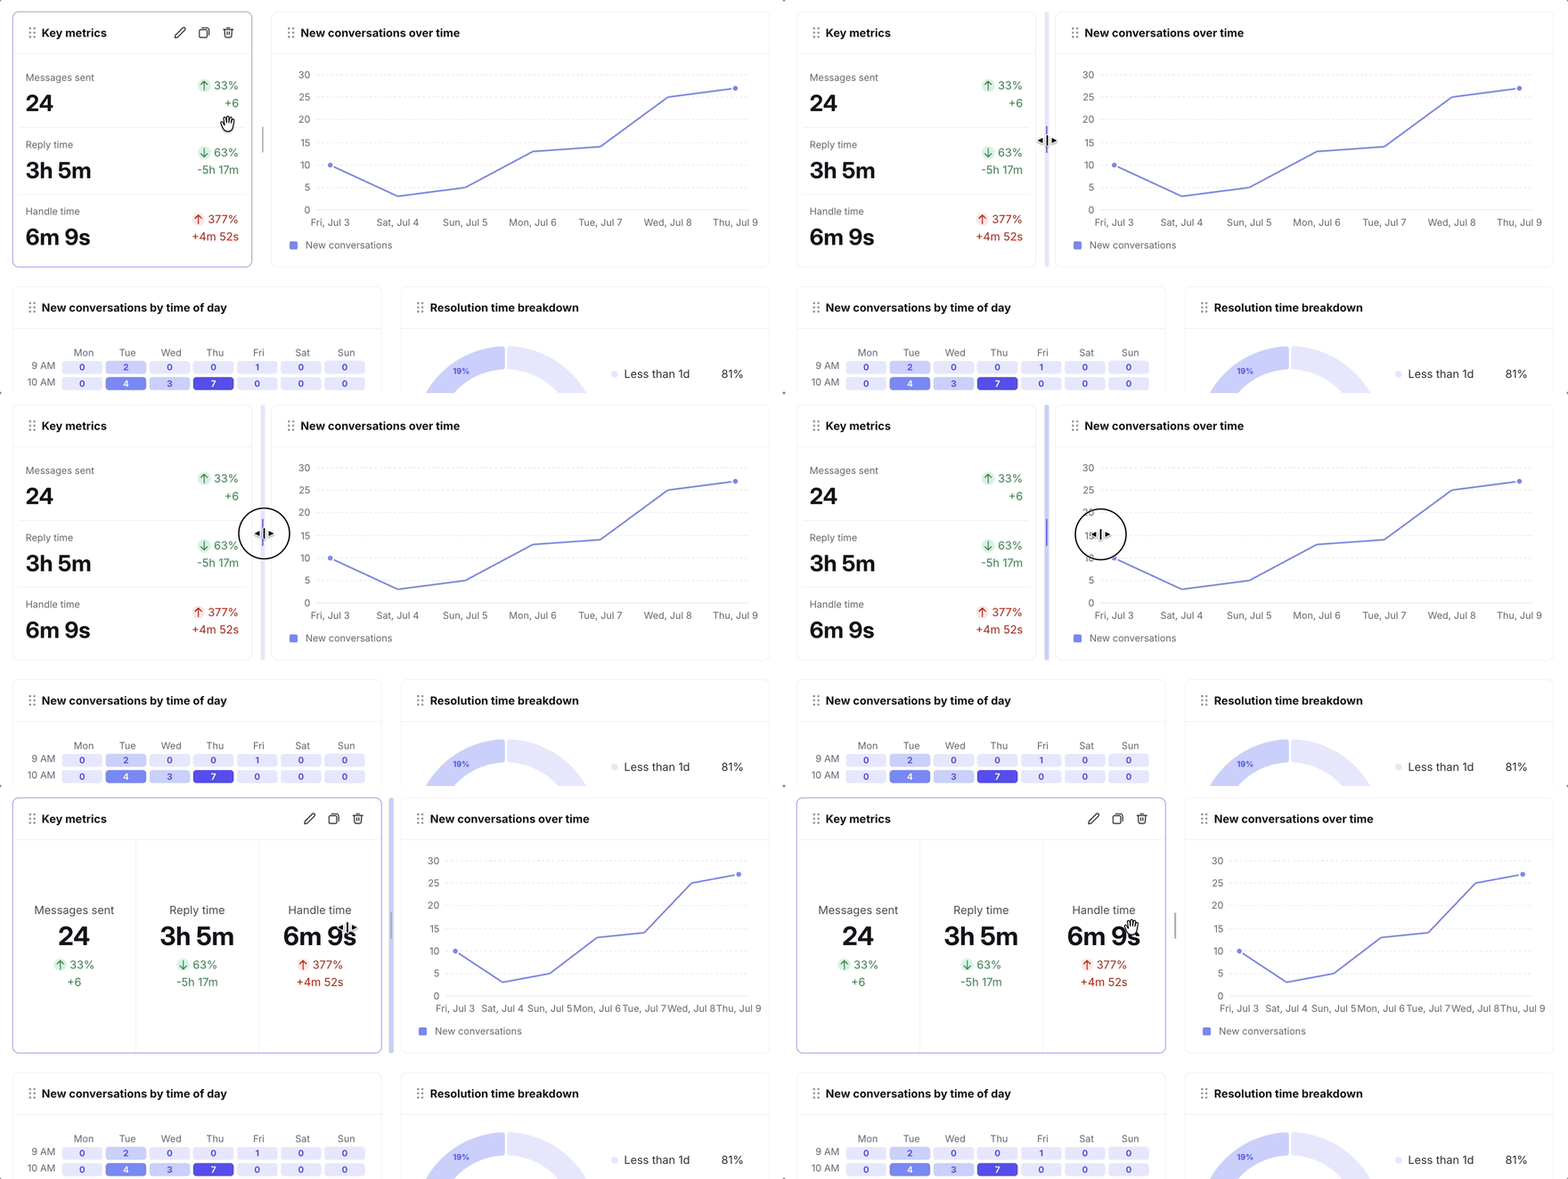
Resize charts
Click and drag applicable charts to change the chart size.
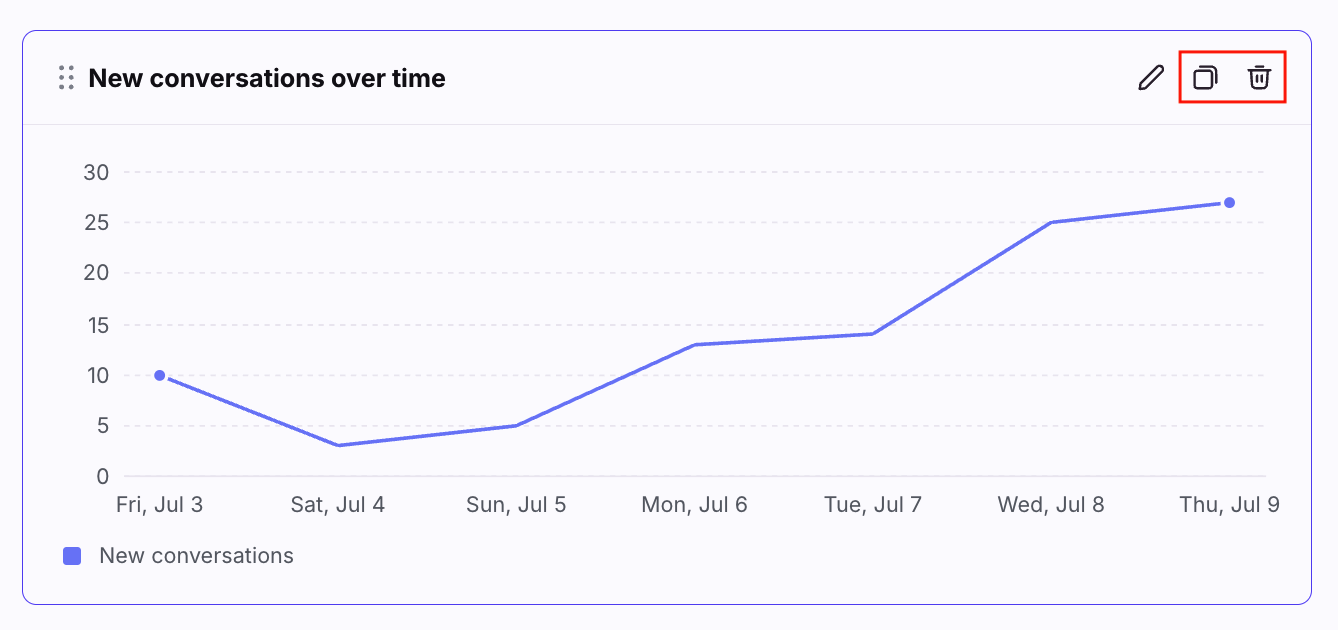
Duplicate and delete charts
Hover over a chart, then click the Duplicate or Delete icons to quickly customize your report.
Editing reports
To change the metrics displayed in your charts, you can edit your reports at any time.
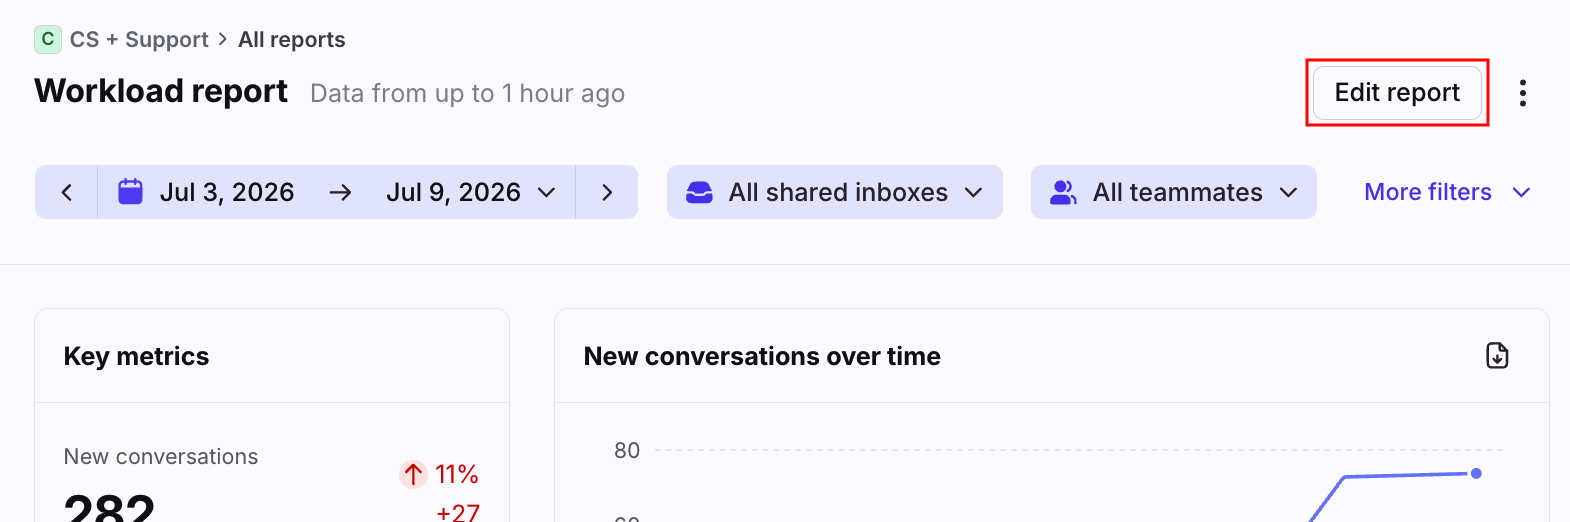
Step 1
Select the report you’d like to modify, then click Edit report.
Step 2
Hover over any chart, click the pencil icon, and make your changes.
Step 3
When finished, click Save as, then select Current report, or New report, depending on how you’d like to proceed.

Other report actions
In the three-dot menu of your report, you can take these actions:
Edit details: Edit the report name and who has access to the report
Unpin from sidebar: Remove the report from the Pinned section in your sidebar
Duplicate: Make a copy of the report
Export data: Download a CSV export of your data. See this article to learn more.
Delete: Permanently delete the report for you and everyone who has access
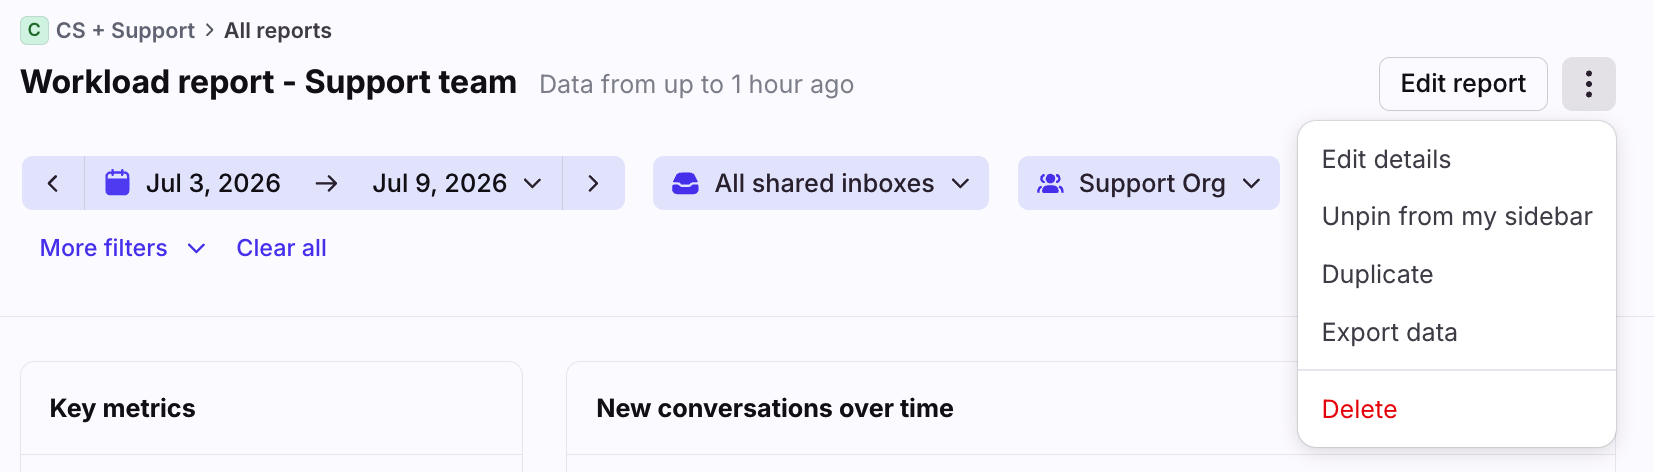
You can also take some of these actions from the All reports list or your sidebar.
FAQ
How do I enable the new experience?
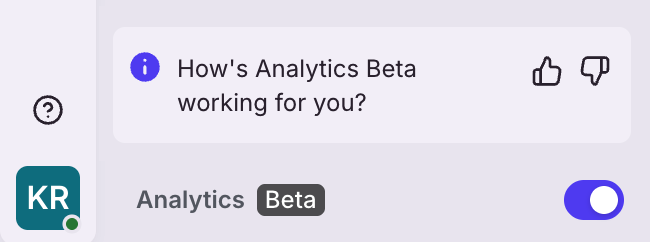
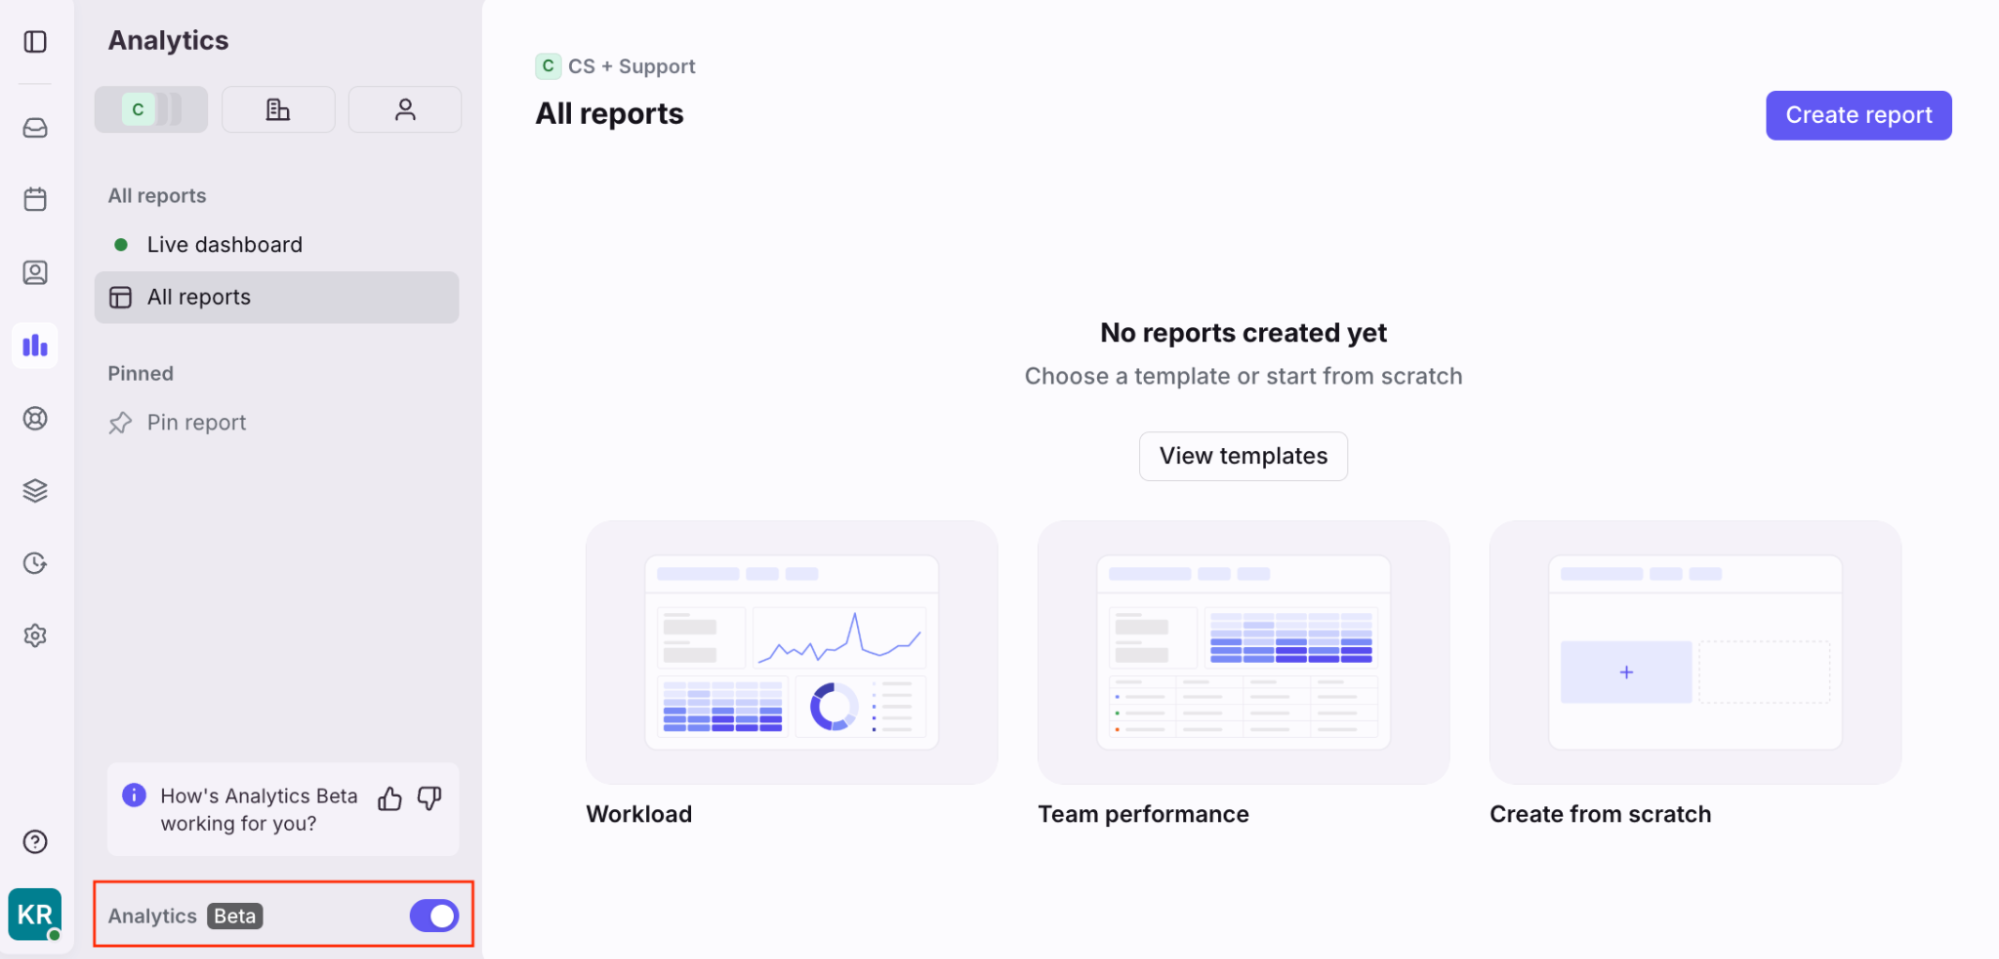
Select Analytics in the navigation menu, then toggle on the Analytics Beta setting. In the future, the new design will be made permanent.
You must have permission to access Analytics to see the toggle.
Are all report types supported?
Not at this time. The Analytics redesign does not currently support the following:
Chatbots report
Knowledge base report
Support report
These will be available in a future update.
How are my pinned reports sorted?
The most recently pinned items are listed at the top of the list. The list cannot be manually rearranged at this time.
How do I share feedback?
Use the thumbs up / thumbs down icons in the sidebar to rate your experience. A pop-up will appear for you to provide more information.
You can also check out our ideas portal here to add an improvement request.